

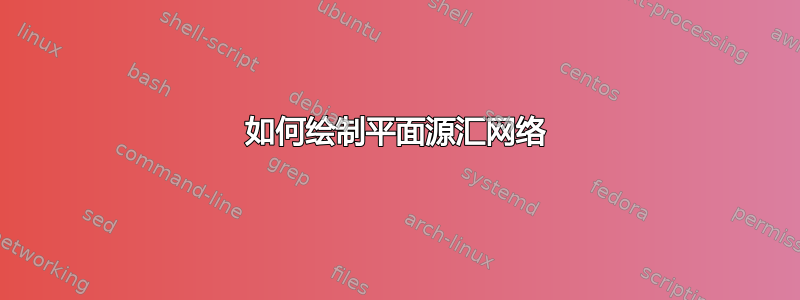
我想知道如何在 LaTex 中绘制平面源汇网络,例如我试图重现的以下网络:


感谢致敬!
答案1
我们的想法是使用其中一个包PGF/TikZ或者PS技巧. 这两个包的文档都包含大量示例。
在TeXample.net你可以找到一些可以用作 PGF/TikZ 灵感来源的代码;特别有用的是图表
在 PS-Tricks 页面中你还可以查看例子和流程图部分包含一个可能有用的示例。
编辑:这是一个TikZ可以为您提供一个起点的基本示例(使用):
\documentclass{article}
\usepackage{tikz}
\usetikzlibrary{positioning}

\begin{document}

\begin{tikzpicture}[%
  every node/.style={draw,fill=gray!40,circle,minimum size=3pt},node distance=1cm]
  % the vertices
  \node[label=left:Source] (source) at (0,0) {1};
  \node[right=of source] (three) {3};
  \node[above=of three] (two) {2};
  \node[below=of three] (four) {4};
  \node[right=of source] (three) {3};
  \node[right=of three] (six) {6};
  \node[above=of six] (five) {5};
  \node[below=of six] (seven) {7};
  \node[right=of six,label=right:Sink] (sink) {8};
  % the edges
  \draw (source) -- (two) -- (five) -- (sink) -- (seven) -- (four) -- (source) -- (three) -- (six) -- (sink);
  \draw (two) -- (three) -- (four);
  \draw (five) -- (six) -- (seven);
\end{tikzpicture}
\end{document}

EDIT2:另一个示例包括虚线曲线和一些边缘标签,如评论中所要求的:
\documentclass{article}
\usepackage{tikz}
\usetikzlibrary{positioning}

\begin{document}

\begin{tikzpicture}
  \begin{scope}[auto,%
  every node/.style={draw,fill=gray!40,circle,minimum size=3pt},node distance=1cm]
  % the vertices
  \node[label=left:Source] (source) at (0,0) {1};
  \node[right=of source] (three) {3};
  \node[above=of three] (two) {2};
  \node[below=of three] (four) {4};
  \node[right=of source] (three) {3};
  \node[right=of three] (six) {6};
  \node[above=of six] (five) {5};
  \node[below=of six] (seven) {7};
  \node[right=of six,label=right:Sink] (sink) {8};
  \end{scope}
  % the edges
  \draw (source) -- node[label=above:4] {} (two) -- node[label=above:7] {} (five) -- node[label=above:8] {} (sink) -- (seven) -- (four) -- (source) -- (three) -- (six) -- (sink);
  \draw (two) -- (three) -- (four);
  \draw (five) -- (six) -- (seven);
  \draw[dashed] (two) to [bend right=95] (source);
  \draw[dashed] (five) to [bend left=95] (sink);
  \draw[dashed] (source) ..  controls (1,-3.5) and (4,-3.5) .. (sink);

\end{tikzpicture}

\end{document}
EDIT3:另一个例子:
\documentclass{article}
\usepackage{tikz}
\usetikzlibrary{positioning}

\begin{document}

\begin{tikzpicture}[%
  every node/.style={draw,fill=gray!40,circle,minimum size=18pt,font=\footnotesize},
  node distance=3cm,on grid]
  % the vertices
  \node[label=left:Source] (source) at (0,0) {1};
  \node[right=of source] (three) {3};
  \node[above=of three] (two) {2};
  \node[below=of three] (four) {4};
  \node[right=of source] (three) {3};
  \node[right=of three] (six) {6};
  \node[above=of six] (five) {5};
  \node[below=of six] (seven) {7};
  \node[right=of six,label=right:Sink] (sink) {8};
  \node at (1.9,1) (sfive) {$5^*$};
  \node at (4.5,1) (sseven) {$7^*$};
  \node at (7.1,1) (ssix) {$6^*$};
  \node at (1.9,-1) (sthree) {$3^*$};
  \node at (4.5,-1) (stwo) {$2^*$};
  \node at (7.1,-1) (sfour) {$4^*$};
  \node at (4.5,4) (seight) {$8^*$};
  \node at (4.5,-4) (sone) {$1^*$};
  % the edges
  \draw (source) -- (two) -- (five) -- (sink) -- (seven) -- (four) -- (source) -- (three) -- (six) -- (sink);
  \draw (two) -- (three) -- (four);
  \draw (five) -- (six) -- (seven);
  \begin{scope}[dashed]
  \draw (sfive) -- (sseven) -- (ssix) -- (sfour) -- (stwo) -- (sthree) -- (sfive);
  \draw (sthree) to [bend right=55] (sone);
  \draw (sfour) to [bend left=55] (sone);
  \draw (sfive) to [bend left=55] (seight);
  \draw (ssix) to [bend right=55] (seight);
  \draw (source) ..  controls (1,-6.5) and (8,-6.5) .. node[draw=none, fill=none,label=above:$s^*$] {} (sink);
  \end{scope}
\end{tikzpicture}

\end{document}
结果如下:

答案2
两个例子:
\documentclass[landscape,dvips]{article}
\usepackage{pstricks-add,pst-slpe,geometry}

\parindent=0pt
\begin{document}

\begin{pspicture}(-0.5,-0.5)(6.5,6.5)
\psset{fillstyle=ccslope,slopebegin=magenta!40,slopeend=yellow}
\cnodeput(4,6){D}{\strut\boldmath$D$}
\cnodeput(2,4){B}{\strut\boldmath$B$}
\cnodeput(0,2){P}{\strut\boldmath$P$}
\cnodeput(4,2){C}{\strut\boldmath$C$}
\cnodeput(2,0){M}{\strut\boldmath$M$}
\cnodeput(6,0){L}{\strut\boldmath$L$}
\psset{fillstyle=none}
\newcommand\arc[4]{\ncline{#1}{#2}{#3}\ncput{\colorbox{lightgray}{#4}}}
\arc{->}{D}{B}{10}  \arc{->}{B}{P}{10}
\arc{<->}{P}{M}{4}  \arc{<-}{M}{L}{10}
\arc{<->}{M}{B}{10} \arc{->}{C}{B}{3}
\arc{<->}{C}{D}{5}  \arc{<->}{C}{M}{9}
\arc{<->}{C}{L}{4}  \ncarc[arcangle=30]{<->}{D}{L}
\ncput{\colorbox{lightgray}{11}}
\end{pspicture}
%
\qquad
\begin{pspicture}(-1.5,-0.5)(9.5,7.5)
\psset{fillstyle=ccslope,slopebegin=cyan!40,slopeend=yellow}
  \cnodeput(0,0){K}{\strut\boldmath$K$}
  \cnodeput(0,2){F}{\strut\boldmath$F$}
  \cnodeput(-1,4){D}{\strut\boldmath$D$}
  \cnodeput(3,7){H}{\strut\boldmath$H$}
  \cnodeput(8,5){B}{\strut\boldmath$B$}
  \cnodeput(9,2){N}{\strut\boldmath$N$}
  \cnodeput(5,0){M}{\strut\boldmath$M$}
  \cnodeput(3,1){S}{\strut\boldmath$S$}
\psset{arcangle=30,nrot=:U,fillstyle=none}
\newcommand*\arc[3]{\ncarc{#1}{#2}\ncput*{#3}}
\newcommand*\rarc[3]{\ncarc{#2}{#1}\ncput*[nrot=:D]{#3}}
  \arc{K}{F}{120}  \arc{H}{S}{650}
  \arc{H}{M}{780}  \arc{D}{B}{490}
  \arc{D}{M}{600}  \arc{B}{M}{580}
  \arc{H}{N}{600}  \arc{F}{H}{490}
  \rarc{S}{B}{630} \rarc{S}{N}{210}
  \rarc{S}{M}{230}
\end{pspicture}

\end{document}
