

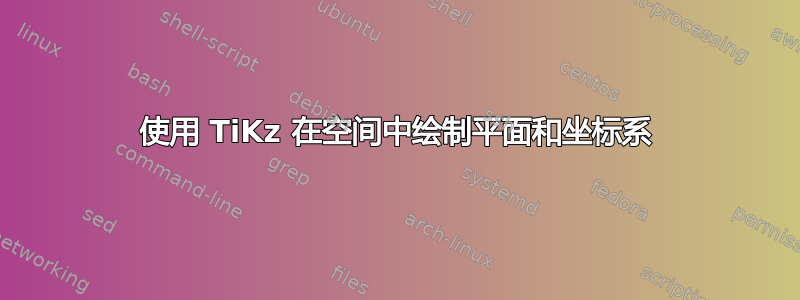
假设我在空间中有一个平面E: a*x_1 + b*x_2 + c*x_3 = d(a、..、d 应该是具体数字)和一个点 P。有没有办法绘制一个三维坐标系,E、P 和通过 P 到 E 的垂直线?
答案1
TikZ 有一个内置的 3D 坐标系。您可以使用x、y和z选项设置单位向量的方向。然后您可以手动进行计算并绘制点和线。或者,您可以定义一些宏来完成这项工作:
\documentclass{article}
\usepackage{tikz}

\makeatletter

% Set some defaults
\tikzset{
    plane max x/.initial=2,
    plane max y/.initial=2,
    plane max z/.initial=2
}

\tikzset{plane/.style={fill opacity=0.5}}

% Define a plane.
% #1 = name of the plane
% #2*x + #3*y + #4*z = #5 is the equation of the plane
\newcommand*\definePlaneByEquation[5]{
    \expandafter\gdef\csname tsx@plane@#1\endcsname{
        \def\tsx@plane@xcoeff{#2}
        \def\tsx@plane@ycoeff{#3}
        \def\tsx@plane@zcoeff{#4}
        \def\tsx@plane@scalar{#5}
    }
}

% Draw a plane.
% The optional first argument is passed as options to TikZ.
% The mandatory second argument is the name of the plane.
\newcommand\drawPlane[2][]{
    \tikzset{plane max x/.get=\tsx@plane@maxx}
    \tikzset{plane max y/.get=\tsx@plane@maxy}
    \tikzset{plane max z/.get=\tsx@plane@maxz}
    \csname tsx@plane@#2\endcsname

    \ifdim\tsx@plane@xcoeff pt=0pt
        \ifdim\tsx@plane@ycoeff pt=0pt
            \ifdim\tsx@plane@zcoeff pt=0pt
                %invalid plane
            \else % x=0, y=0
                \filldraw[plane,#1,shift={(0,0,\tsx@plane@scalar/\tsx@plane@zcoeff)}]
                    (0,0,0) --
                    (\tsx@plane@maxx,0,0) --
                    (\tsx@plane@maxx,\tsx@plane@maxy,0) --
                    (0,\tsx@plane@maxy,0) --
                    cycle;
            \fi
        \else % x=0, y != 0
            \ifdim\tsx@plane@zcoeff pt=0pt % x=0, z=0
                \filldraw[plane,#1,shift={(0,\tsx@plane@scalar/\tsx@plane@ycoeff,0)}]
                    (0,0,0) --
                    (\tsx@plane@maxx,0,0) --
                    (\tsx@plane@maxx,0,\tsx@plane@maxz) --
                    (0,0,\tsx@plane@maxz) --
                    cycle;
            \else % x=0
                \filldraw[plane,#1]
                    (0,\tsx@plane@scalar/\tsx@plane@ycoeff,0) --
                    (0,0,\tsx@plane@scalar/\tsx@plane@zcoeff) --
                    (\tsx@plane@maxx,0,\tsx@plane@scalar/\tsx@plane@zcoeff) --
                    (\tsx@plane@maxx,\tsx@plane@scalar/\tsx@plane@ycoeff,0) --
                    cycle;
            \fi
        \fi
    \else % x!=0
        \ifdim\tsx@plane@ycoeff pt=0pt % x!=0,y=0
            \ifdim\tsx@plane@zcoeff pt=0pt % x!=0,y=0,z=0
                \filldraw[plane,#1,shift={(\tsx@plane@scalar/\tsx@plane@xcoeff,0,0)}]
                    (0,0,0) --
                    (0,0,\tsx@plane@maxz) --
                    (0,\tsx@plane@maxy,\tsx@plane@maxz) --
                    (0,\tsx@plane@maxy,0) --
                    cycle;
            \else % x!=0,y=0,z!=0
                \filldraw[plane,#1]
                    (\tsx@plane@scalar/\tsx@plane@xcoeff,0) --
                    (0,0,\tsx@plane@scalar/\tsx@plane@zcoeff) --
                    (0,\tsx@plane@maxy,\tsx@plane@scalar/\tsx@plane@zcoeff) --
                    (\tsx@plane@scalar/\tsx@plane@xcoeff,\tsx@plane@maxy,0) --
                    cycle;
            \fi
        \else % x!=0,y!=0
            \ifdim\tsx@plane@zcoeff pt=0pt % x!=0,y!=0,z=0
                \filldraw[plane,#1]
                    (\tsx@plane@scalar/\tsx@plane@xcoeff,0) --
                    (0,\tsx@plane@scalar/\tsx@plane@ycoeff,0) --
                    (0,\tsx@plane@scalar/\tsx@plane@ycoeff,\tsx@plane@maxz) --
                    (\tsx@plane@scalar/\tsx@plane@xcoeff,0,\tsx@plane@maxz) --
                    cycle;
            \else % x!=0,y!=0,z!=0
                \filldraw[plane,#1]
                    (\tsx@plane@scalar/\tsx@plane@xcoeff,0,0) --
                    (0,\tsx@plane@scalar/\tsx@plane@ycoeff,0) --
                    (0,0,\tsx@plane@scalar/\tsx@plane@zcoeff) --
                    cycle;
            \fi
        \fi
    \fi
}

% Define a point.
% #1 = name of the point
% (#2,#3,#4) is the location.
% Also creates a coordinate node of name #1 at the location.
\newcommand\definePointByXYZ[4]{
    \coordinate (#1) at (#2,#3,#4);
    \expandafter\gdef\csname tsx@point@#1\endcsname{
        \def\tsx@point@x{#2}
        \def\tsx@point@y{#3}
        \def\tsx@point@z{#4}
    }
}

% Project a point to a plane.
% #1 = name of the new point
% #2 = name of old point
% #3 = name of plane
\newcommand\projectPointToPlane[3]{{
    \csname tsx@point@#2\endcsname
    \csname tsx@plane@#3\endcsname

    % square of norm of the normal vector
    \pgfmathparse{\tsx@plane@xcoeff*\tsx@plane@xcoeff + \tsx@plane@ycoeff*\tsx@plane@ycoeff + \tsx@plane@zcoeff*\tsx@plane@zcoeff}
    \let\nnormsq\pgfmathresult

    % Calculate distance in terms of the (non-normalized) normal vector
    \pgfmathparse{(\tsx@point@x*\tsx@plane@xcoeff + \tsx@point@y*\tsx@plane@ycoeff + \tsx@point@z*\tsx@plane@zcoeff - \tsx@plane@scalar) / \nnormsq}
    \let\distance\pgfmathresult

    % Calculate point
    \pgfmathparse{\tsx@point@x - \distance*\tsx@plane@xcoeff}
    \let\x\pgfmathresult
    \pgfmathparse{\tsx@point@y - \distance*\tsx@plane@ycoeff}
    \let\y\pgfmathresult
    \pgfmathparse{\tsx@point@z - \distance*\tsx@plane@zcoeff}
    \let\z\pgfmathresult

    \definePointByXYZ{#1}{\x}{\y}{\z}
}}
\makeatother

\begin{document}
\begin{tikzpicture}[x={(240:0.8cm)}, y={(-10:1cm)}, z={(0,1cm)},
        plane max z=3]
    \draw[->] (0,0,0) -- (3,0,0);
    \draw[->] (0,0,0) -- (0,3,0);
    \draw[->] (0,0,0) -- (0,0,3);

    \definePlaneByEquation{myplane}{1}{1.5}{0}{2}
    \drawPlane[thick,fill=blue]{myplane}

    \definePointByXYZ{mypoint}{1}{1.5}{2};
    \draw (mypoint) circle [radius=1pt];

    \projectPointToPlane{proj}{mypoint}{myplane}
    \fill (proj) circle [radius=1pt];

    \draw[->, shorten <=1pt,shorten >=1pt] (mypoint) -- (proj);
\end{tikzpicture}
\end{document}

一些评论:
- 我希望我没有搞砸一些案子。
- 使用
plane max x//选项,y您z可以指定具有零参数的平面应延伸多远。 如果你想画一条通过该点的线,垂直于平面,你可以使用
\definePlaneByEquation{myplane}{1}{1.5}{0}{2}
\definePointByXYZ{mypoint}{1}{1.5}{2};
\projectPointToPlane{proj}{mypoint}{myplane}

\draw ($(proj)!-2cm!(mypoint)$) -- (proj);
\drawPlane[thick,fill=blue]{myplane}
\draw (proj) -- ($(mypoint)!-2cm!(proj)$);
当平面不透明或者线条非黑色时,顺序对于获得正确的覆盖非常重要。
- 0 的检验实际上应该是小于 epsilon 的检验。
\pgfmathparse也许将其应用于定义宏的参数会很有用。