

我在网站上找到了一些时间线的示例,但它们似乎不适合我想要创建的图表类型。
基本上,我想创建一个你在书中看到的时间线,你可以比较不同作者的几辈子,以便了解他们何时出生和何时去世。
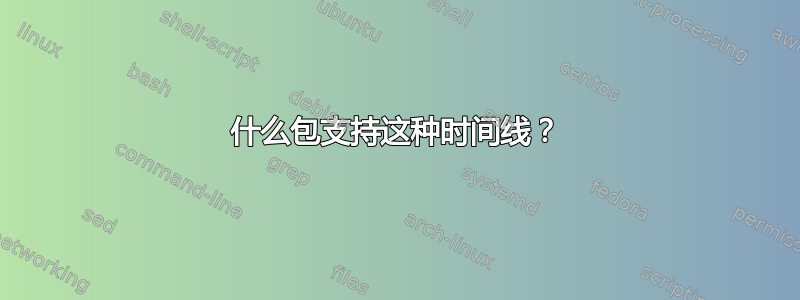
我想要做的一个现实的例子是:

注意:突出显示颜色是任意的,我不要求它是特定的灰度。但如果有自定义选项,那肯定会是一个加分项。
然而,这有一定的限制。我想涵盖的时间范围包括150年:从 1790 年到 1940 年,我尝试的所有包都超出了页面限制,即使使用了该landscape选项。
更新:我感谢大家提供的帮助,解决方案看起来不错。但我认为我的例子有点误导。我之所以不选择该解决方案或采用表格解决方案,是因为条形图只能在常规点开始和结束,因此如果某人出生于“1903 年”,如果我们使用表格,条形图将无法以精确的方式指示此类日期。如果这破坏了答案,我深表歉意,但我需要指出这一点。
如果您在回答中考虑到了这一点,但没有明确说明或者我错过了,请告诉我。
答案1

答案2
不确定现有的包,但是这个很接近:

\documentclass[a4paper]{article}

\usepackage{lscape,color}

\def\personbox#1{%
\hbox to 0pt{\hss\color{black}#1\hss}}

\def\person#1#2#3{%
\noalign{%
\global\count1 #1\relax
\global\advance\count1 -1790
\global\count3 #2\relax
\global\advance\count3 -#1\relax}%
\multispan{\count1}{\hfill}&%
\multispan{\count3}{\strut\color[gray]{0.7}\leaders\vrule\hfill\mbox{}
\hskip0pt plus -.5fill\personbox{#3}\hskip0pt plus.5fill}\crcr}


\addtolength\textheight{100pt}

\begin{document}
\begin{landscape}
\centering
\begin{tabular}{@{}@{}*{151}{p{1.7mm}@{}@{}}}
\person{1900}{1930}{person}
\person{1810}{1920}{another person}
\person{1870}{1935}{a different person}
\hline
\rotatebox{90}{\llap{\smash{\ \ 1790}}}&&&&&&&&&&
\rotatebox{90}{\llap{\smash{\ \ 1800}}}&&&&&&&&&&
\rotatebox{90}{\llap{\smash{\ \ 1810}}}&&&&&&&&&&
\rotatebox{90}{\llap{\smash{\ \ 1820}}}&&&&&&&&&&
\rotatebox{90}{\llap{\smash{\ \ 1830}}}&&&&&&&&&&
\rotatebox{90}{\llap{\smash{\ \ 1840}}}&&&&&&&&&&
\rotatebox{90}{\llap{\smash{\ \ 1850}}}&&&&&&&&&&
\rotatebox{90}{\llap{\smash{\ \ 1860}}}&&&&&&&&&&
\rotatebox{90}{\llap{\smash{\ \ 1870}}}&&&&&&&&&&
\rotatebox{90}{\llap{\smash{\ \ 1880}}}&&&&&&&&&&
\rotatebox{90}{\llap{\smash{\ \ 1890}}}&&&&&&&&&&
\rotatebox{90}{\llap{\smash{\ \ 1900}}}&&&&&&&&&&
\rotatebox{90}{\llap{\smash{\ \ 1910}}}&&&&&&&&&&
\rotatebox{90}{\llap{\smash{\ \ 1920}}}&&&&&&&&&&
\rotatebox{90}{\llap{\smash{\ \ 1930}}}&&&&&&&&&&
\rotatebox{90}{\llap{\smash{\ \ 1940}}}
\end{tabular}
\end{landscape}
\end{document}
答案3
使用一个简单的表格:
\documentclass[a4paper]{article}
\usepackage[table]{xcolor}
\def\MC#1#2{\multicolumn{#1}{|>{\cellcolor{black!20}}c|}{#2}}
\begin{document}

\def\arraystretch{1.3}
\begin{tabular}{| *5c | *5c |}                    \hline
 & & & \MC{3}{a person} & & & &                   \\\hline
 & \MC{4}{another person} & & & & &               \\\hline
 & & & & & & & \MC{3}{yet another person}         \\\hline
 & & & & \MC{4}{wow, another person again} & &    \\\hline
1965 & 1970 & 1975 & 1980 & 1985 & 1990 & 1995 & 2000 & 2005 & 2010\\\hline
\end{tabular}

\end{document}

答案4
如果输出仅供 pdf 阅读器查看,则可以使用 geometry 包创建一个非常大的虚拟页面。我选择 11 英寸高、100 英寸宽(我怀疑 TeX 尺寸限制最大为 226 英寸)
这样可以制作出漂亮的时间轴,如果您有绘图仪或可以细分大页面的打印机,则可以将其打印出来。我使用了幻灯片类和 \Huge,这样您就可以看到它在普通 pdf 视图中工作。使用 12 pt 字符,每行可以得到大约 2700 个字符。
\documentclass[12pt,letterpaper]{slides}
\usepackage{lipsum}
\usepackage[paperwidth=100in, paperheight=11in,margin=1in]{geometry}
\begin{document}
\Huge
\lipsum[1-10]
\end{document}