

我想创建一个surf从顶部看的图(如 Matlab 中的网格)。经过一番研究,我发现了实现此目的的这种方法:
\begin{tikzpicture}
 \begin{axis}{view={0}{90}]
  \appplot3[surf] table {datafile.dat};
 \end{axis}
\end{tikzpicture}
目前,我想要绘制的数据是一个 400 x 1000 的矩阵,其中矩阵中的值代表高度(或颜色)。
我需要生成哪种格式datafile.dat才能\addplot3[surf]读取它?
我发现了几种格式:
(x value, y value, z value)
(x value, y value)[ z value]
对我来说,简单的方法是简单地生成一个大小为 400 x 1000 的矩阵,其中包含 z 值,并且还可以缩放 x 轴和 y 轴的值。
编辑
我按照 Jake 给出的格式生成了一个文件。正如 jake 所说,使用pdflatexreturned TeX capacity exceeded, sorry [main memory size=3000000],但从另一边来说,lualatexreturned
! Package pgfplots Error: Could not read table file '/tmp/workfile'. In case yo
u intended to provide inline data: maybe TeX screwed up your end-of-lines? Try
`row sep=crcr' and terminate your lines with `\\' (refer to the pgfplotstable m
anual for details).
这并不专业。
编辑2
我能够创建以下内容 。我使用了以下代码:
\begin{tikzpicture}
 \begin{axis}[view={0}{90},colormap/cool]
  \addplot3[surf] table [row sep=newline] {./workfile.dat};
 \end{axis}
\end{tikzpicture}
我希望值的颜色为白色,在我的图片中,大约 90% 的值是空值,但在图片中情况并非如此(有某种地狱蓝)。如何修复?
是否也可以只考虑大于特定值的值?
在 python matplotlib 中,可以使用 LogNorm 比例来表示颜色。在 tikz 中也可以这样做吗(在本例中)?
答案1
首选格式是
<x1> <y1> <z>
<x1> <y2> <z>
<x1> <y3> <z>

<x2> <y1> <z>
<x2> <y2> <z>
<x2> <y3> <z>
即具有相同 x 或 y 值的坐标行块,由空行分隔。如果省略空行,则必须告诉 PGFplots 您的网格中有多少行或多少列。
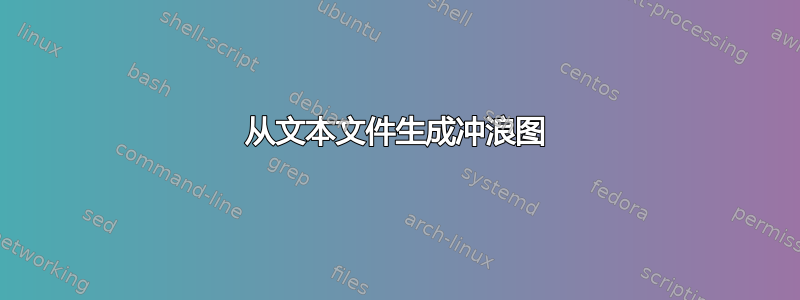
volcano以下是R 附带的数据集示例。我使用了
library(reshape)
data(volcano)
molten <- melt(volcano)
write.table(molten, row.names=F, "volcano.dat")
将矩阵结构转换为坐标列表。前十行如下所示
1 1 100
2 1 101
3 1 102
4 1 103
5 1 104
6 1 105
7 1 105
8 1 106
9 1 107
10 1 108
然后可以使用 PGFplots 绘制。但请注意,这是一项非常耗费内存的任务,即使是 87 x 61 的volcano数据集也只能使用 绘制,lualatex因为pdflatex会超出其内存限制。绘制 400 x 1000 的矩阵需要很长时间。

最好在外部程序中生成绘图图像R,然后使用 PGFplots 添加轴和标签。
volcano以下是使用生成数据集热图的示例R,没有边距或轴:
data(volcano)
png("volcano.png")
par(mar=c(0,0,0,0))
image(volcano,col=terrain.colors(50),axes=F)
dev.off()
然后可以在 PGFPlots 图中使用它
\documentclass{article}

\usepackage{pgfplots}

\begin{document}
\begin{tikzpicture}
\begin{axis}[enlargelimits=false, axis on top]
\addplot graphics [xmin=0,xmax=87,ymin=0,ymax=61] {volcano.png};
\end{axis}
\end{tikzpicture}
\end{document}