


我有一条波浪形曲线,想显示相应的法线坐标系,该坐标系由沿曲线的弧长和与曲线的距离(有符号)定义。因此,应该有与曲线垂直的线(用于弧长)和与原始曲线平行的曲线(用于与曲线的距离)。
我正在使用的解决方案TikZ 中的简单曲线画出我的波浪曲线,如何在 TikZ 中绘制路径上任意点的切线得到法线。我可以double distance=1cm使用如何提高通用曲线。\pgfdeclaredecoration 的问题,但我不确定如何获得一整组平行线。
最终,我还想要标记线条/曲线的节点s=1,,s=2...... r=1,,,r=2... r=0,,r=-1...
这是我当前的代码:
\documentclass[10pt]{amsart}
\usepackage{tikz}
\usetikzlibrary{decorations.markings}
\tikzstyle{tangent}=[decoration={markings,% switch on markings
mark= at position #1 with {
\coordinate (tangent point-\pgfkeysvalueof{/pgf/decoration/mark info/sequence number}) at (0pt,0pt);
\coordinate (tangent unit vector-\pgfkeysvalueof{/pgf/decoration/mark info/sequence number}) at (1,0pt);
\coordinate (tangent orthogonal unit vector-\pgfkeysvalueof{/pgf/decoration/mark info/sequence number}) at (0pt,1); }}, postaction=decorate]
\tikzstyle{use tangent}=[
shift=(tangent point-#1),
x=(tangent unit vector-#1),
y=(tangent orthogonal unit vector-#1)]
\tikzset{forcedist/.style={decorate, decoration={markings,
mark=between positions 0 and 1 step 0.0999 with {\draw[<-] (0,-#1) -- (0,#1); }}}}%Here
\tikzset{use tangent/.default=1}
\begin{document}
\begin{figure}
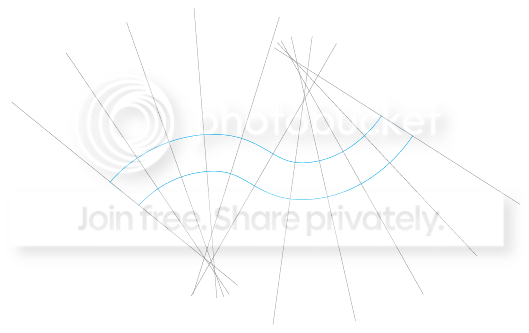
\begin{tikzpicture}[scale=.75]
\draw [cyan, double distance = 1cm, tangent=0.001,tangent=0.1,tangent=0.2,tangent=0.3,tangent=0.4,tangent=0.5,tangent=0.6,tangent=0.7,tangent=0.8,tangent=0.9,tangent=0.999] plot [smooth, tension=1] coordinates { (0,.5) (3,2) (7,1) (10,3)};
\foreach \i in {1,...,11} { \draw [very thin,gray,use tangent=\i] (0,-4) -- (0,4); }
\end{tikzpicture}
\end{figure}
\end{document}
答案1
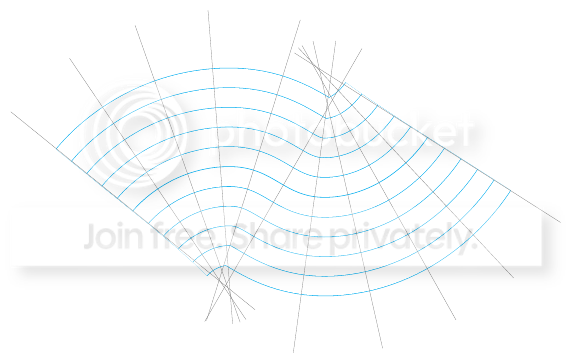
阅读手册后,“双倍距离”只是一条宽度较大的线......所以这是一种产生我想要的东西的黑客方式:
(使用与上述相同的序言)
\begin{tikzpicture}[scale=.75]
\foreach \i in {5,...,1} {
\draw [cyan, double distance = \i cm, tangent=0.001,tangent=0.1,tangent=0.2,tangent=0.3,tangent=0.4,tangent=0.5,tangent=0.6,tangent=0.7,tangent=0.8,tangent=0.9,tangent=0.999] plot [smooth, tension=1] coordinates { (0,.5) (3,2) (7,1) (10,3)}; }
\draw [cyan, tangent=0.001,tangent=0.1,tangent=0.2,tangent=0.3,tangent=0.4,tangent=0.5,tangent=0.6,tangent=0.7,tangent=0.8,tangent=0.9,tangent=0.999] plot [smooth, tension=1] coordinates { (0,.5) (3,2) (7,1) (10,3)};
\foreach \i in {1,...,11} { \draw [very thin,gray,use tangent=\i] (0,-4) -- (0,4); }
\end{tikzpicture}
请随意提交其他答案,因为我觉得应该有更优雅的方式来做到这一点!!