

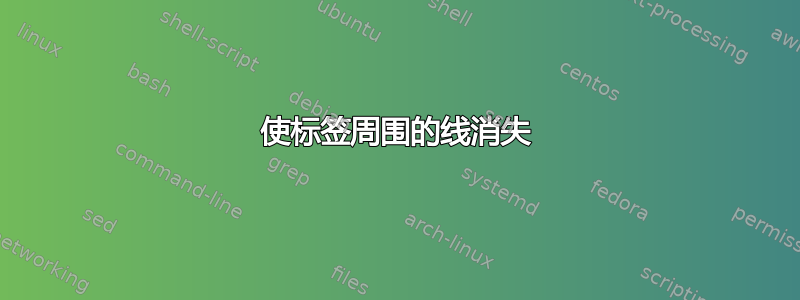
参照 如何绘制下面的图表?
是否可以让标签周围的线以及坐标的顶部和右侧线消失?
答案1
继续上一个问题:
\documentclass{standalone}
\usepackage{pgfplots}
\pgfplotsset{compat=1.7}
\begin{document}
{
% http://tex.stackexchange.com/questions/50313/everymath-and-set-font-for-math
\everymath{\mathsf{\xdef\mysf{\mathgroup\the\mathgroup\relax}}\mysf}

\begin{tikzpicture}[font=\sffamily]
\begin{semilogyaxis}[title=\textbf{QWS Dataset},
    legend pos=outer north east,
        legend style={draw=none},
        xtick={1,...,10},
    scaled ticks=false,
    log ticks with fixed point={1000 sep=},
        axis x line=bottom,
    axis y line=left,
        axis line style=-,
        minor tick style={draw=none},
        enlargelimits,
    width=7cm,
    ylabel = Computation Time (msec),
    xlabel = Number of Service Candidates Per Class
]
\addplot plot coordinates {(2, 48)(3,336)(4,2048)(5, 11520)(6, 61440)(7,1315392)};
\addplot plot coordinates {(2, 37)(3, 275)(4,1726)(5, 9953)(6, 55387)(7, 297786)};
\addplot plot coordinates {(2, 43)(3,252)(4, 1421)(5, 7256)(6, 37561)(7,81679)};
\legend{Unreduced, Symmetric, Asymmetric}
\end{semilogyaxis}
\end{tikzpicture}
}
\end{document}
