

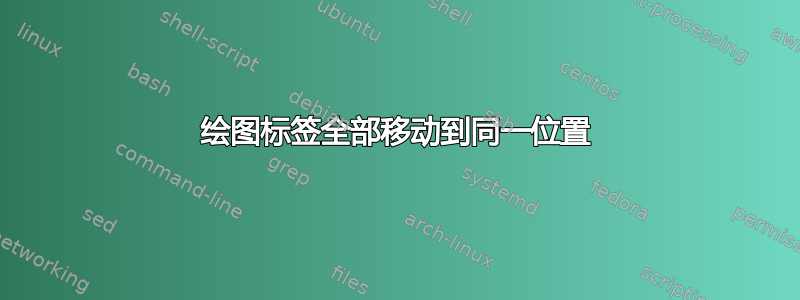
我正在尝试创建由函数确定位置的绘图标签。根本问题是标签不会停留在放置的位置,而是全部移动到最后放置标签的位置。
\documentclass[11pt]{article}
\usepackage{pgfplots}
\usetikzlibrary{calc}

\begin{document}
\def\MyFunction(#1, #2){(#1/1000)^2 * (#2/1000)^2 * 175}

\begin{figure}
\centering
\begin{tikzpicture}
    \begin{axis}
    [
     width=12cm, grid=major,
     ymin=0, ymax=30,
     xmin=0, xmax=1000, domain=0:1000, samples=100
    ]
    \edef\L{450}
    \addplot [solid] {\MyFunction(\L, x)};

    \pgfmathparse{\MyFunction(\L, 500)}
    \edef\tmp{\pgfmathresult}
    \node[anchor=south west, fill=white, fill opacity=0.5] (pt450) at ($(axis cs:500,\tmp)+(0.5cm,-0.5cm)$) {\L 1st};
    \draw[->](pt450.south east)--(pt450.south west)--(axis cs:500,\tmp);

    \edef\L{620}
    \addplot [solid] {\MyFunction(\L, x)};
    \pgfmathparse{\MyFunction(\L, 500)}
    \edef\tmp{\pgfmathresult}
    \node[anchor=south west, fill=white, fill opacity=0.5] (pf620) at ($(axis cs:500,\tmp)+(0.5cm,-0.5cm)$) {\L 2nd};
    \draw[->](pf620.south east)--(pf620.south west)--(axis cs:500,\tmp);
    \end{axis}
\end{tikzpicture}
\end{figure}
\end{document}
我的最终目标是\foreach生成多个图(带标签),而无需代码冗余,这就是为什么我没有对第二个实例使用不同的变量名。是的,我将生成动态节点名称,但为了简单起见,这里将其删除。
我也愿意接受其他放置标签的方法,因为这种方法看起来比实际更复杂。
答案1
正如您所说,这个问题与扩展问题有关:PGFPlots 将许多对象的实际放置延迟到稍后的点(直到轴限制确定之后),并将需要放置的东西保存在未扩展状态。因此,当您的节点实际被绘制时,宏\L只包含最后一个值。要解决这个问题,您可以使用标准方法定义一个临时宏,在其中展开您需要的所有值的宏。对于您来说,您可以使用类似这样的方法:
\edef\dostuff{%
    \noexpand\node[anchor=south west, fill=white, fill opacity=0.5] (pt450) at ($(axis cs:500,\tmp)+(0.5cm,-0.5cm)$) {\L 1st};
    \noexpand\draw[->](pt450.south east)--(pt450.south west)--(axis cs:500,\tmp);
}\dostuff
但是,PGFPlots 还提供了自己的循环命令,负责扩展循环的内容。它被称为。利用这个命令以及 PGFPlots 通过添加到命令\pgfplotsinvokeforeach{<list>}{...<code using #1 for the current list element>...}中来沿图放置节点的能力,您可以得到这个node ...\addplot

使用以下代码
\documentclass[11pt]{article}
\usepackage{pgfplots}
\usetikzlibrary{calc}

\begin{document}
\def\MyFunction(#1, #2){(#1/1000)^2 * (#2/1000)^2 * 175}
\tikzset{
    label node/.style={
        anchor=south west,
        xshift=1em, yshift=-2ex,
        inner sep=2pt,
        pos=0.5,
        name=labelnode,
        append after command={
            (labelnode.south east) -- (labelnode.south west) -- +(-0.8em,1.6ex)}
    }
}


\begin{figure}
\centering
\begin{tikzpicture}
    \begin{axis}
    [
     width=12cm, grid=major,
     ymin=0, ymax=30,
     xmin=0, xmax=1000, domain=0:1000, samples=100
    ]
    \pgfplotsinvokeforeach{420, 620}{
        \addplot [solid] {\MyFunction(#1, x)} node [label node] {#1};
    }
    \end{axis}
\end{tikzpicture}
\end{figure}
\end{document}