

我正在使用该subcaption包,我想知道如何将子图的标题放在每个子图的底部中心。
\documentclass[12pt,a4paper]{article}
%
%
\usepackage{utopia}
\usepackage{enumitem}
\usepackage[usenames,dvipsnames]{color}
\usepackage[superscript,ref,nomove]{cite}
\usepackage{textcomp}
\usepackage{verbatim, amsmath, amsfonts, amssymb, amsthm}
\usepackage[british]{babel}
\usepackage{float}
\usepackage{graphicx}
\usepackage{booktabs,longtable,rotating}
\usepackage{array,warpcol}
\usepackage{multirow}
\usepackage{fixme}
\usepackage[section,verbose]{placeins}
\usepackage{gensymb,units}
\usepackage{fancyhdr}
\usepackage{setspace}
\usepackage{microtype}
\usepackage{stfloats}
%
\usepackage[width=11cm,font=footnotesize,labelfont=bf%
,format=hang,labelformat=parens,labelsep=endash,%
justification=raggedright,singlelinecheck=on]{caption} % Captions.
\usepackage{subcaption}
\captionsetup[sub]{width=6cm,font=scriptsize,labelfont=bf%
,format=hang,labelformat=parens,labelsep=endash,%
justification=centering,singlelinecheck=on}
%
\usepackage{fixltx2e}
\usepackage{varwidth}
\usepackage{todonotes}
\usepackage[pageanchor=true,plainpages=false,pagebackref=false%
,hyperindex=true,hyperfootnotes=true,linktocpage=false%
,colorlinks=true,citecolor=blue,menucolor=red,bookmarks=true%
,bookmarksnumbered=true,pdftitle={Latitude and Month Correction},pdfauthor={Muhammad Hamdy Al-bassoussi},pdfkeywords={Cooling Load},pdfdisplaydoctitle=true,pdffitwindow=true,pdfmenubar=true%
,pdftoolbar=true,pdfwindowui=true,pdfpagelayout=OneColumn]{hyperref}
%
\graphicspath{{./Figures/}} %To set the first directory to search for images in.
%
%\setlength{\parindent}{0pt}
\setlength{\parskip}{2ex plus 0.5ex minus 0.2ex}
%\parindent0em
%\parskip\medskipamount
%
\renewcommand{\baselinestretch}{1.25}
%
\pagestyle{fancy}
\fancyhf{}
\cfoot{\bfseries{\thepage}}
\rfoot{\scriptsize\bf{Latitude \& Month Correction}}
\lfoot{\scriptsize\bf{M. Hamdy}}
\renewcommand{\headrulewidth}{0pt}
\renewcommand{\footrulewidth}{0.5pt}
%\addtolength{\headheight}{0pt} % make space for the rule
\fancypagestyle{plain}{%
\fancyhead{} % get rid of headers on plain pages
\renewcommand{\headrulewidth}{0pt} % and the line
%\fancyfoot{}
%\renewcommand{\footrulewidth}{0pt}
}
%
\renewcommand{\arraystretch}{1.5} % To edit the height of the rows of a table.
%


\begin{document}


\begin{figure}[H]
\begin{subfigure}{0.3\textwidth}
\centering
\includegraphics[height= 6cm, width=12cm]{W80_32N_Sep_S}
\caption{Wall no.(80): 32$^\circ$N - September - South orientaion}
\label{fig:w80}
\end{subfigure}%

\begin{subfigure}{0.3\textwidth}
\centering
\includegraphics[height= 6cm, width=12cm]{W17_56N_Apr_NE}
\caption{Wall no.(17): 56$^\circ$N - April - NourthEast orientaion}
\label{fig:w17}
\end{subfigure}%
\qquad
\caption{Comparing Corrected CLTDs Resulting from Equations~(\ref{eq:corr}) and~(\ref{eq:corr_ash}) with the Calculated CLTDs for Two Different Wall Constructions, Locations, Months, and Orientations.}\label{fig:corr}
\end{figure}

\end{document}
答案1
您使用的subfigure宽度为0.3\textwidth,宽度为6cm。\captionsetup[sub]标题位于该宽度的中央。但图形宽度(如\includegraphics[height= 6cm, width=12cm])大于该宽度。因此出现了所有这些问题。
补救措施:
- 不要使用超过
\includegraphics[width=..]给定值的宽度,并且两者也\begin{subfigure}{....}使用相同的宽度。\captionsetup[sub] - 最好只给出宽度
\includegraphics[width=..]。如果包含height,则应使用keepaspectratio以防止图形扭曲。
使用类似
\begin{figure}[H]
\begin{subfigure}{6cm}
\centering
\includegraphics[width=6cm]{example-image-a}
\caption{Wall no.(80): 32$^\circ$N - September - South orientaion}
\label{fig:w80}
\end{subfigure}%
\hfill                              %% note this addition
\begin{subfigure}{6cm}
\centering
\includegraphics[width=6cm]{example-image-b}
\caption{Wall no.(17): 56$^\circ$N - April - NourthEast orientaion}
\label{fig:w17}
\end{subfigure}%
\qquad
\caption{Comparing Corrected CLTDs Resulting from Equations~(\ref{eq:corr}) and~(\ref{eq:corr_ash}) with the Calculated CLTDs for Two Different Wall Constructions, Locations, Months, and Orientations.}\label{fig:corr}
\end{figure}
答案2
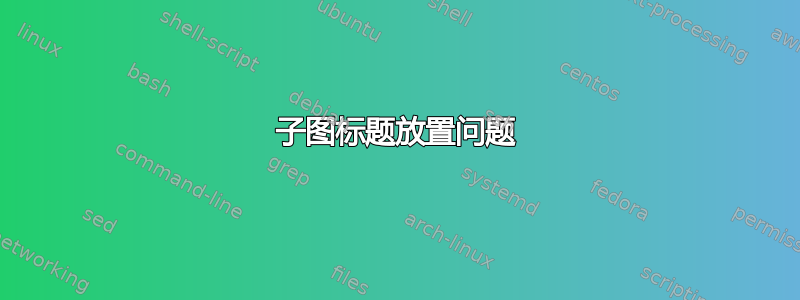
从您的设置中我无法确定您是否希望子图中的图形宽度为 6 厘米(这似乎是语句的参数所指示的)\subcaption或 12 厘米宽(这似乎是语句的可选参数所指示的\includegraphics)。
如果是前者,并且您希望将两个图表并排放置,则应遵循 Harish 在其单独的答案中提供的代码。
如果是后者,即如果两个图表的宽度均为 12 厘米,则它们无法并排显示在 A4 纸上。在这种情况下,您可能需要采取以下措施。请注意,代码设置了宽度minipage;12cm在此环境中,所有宽度引用都是\linewidth(将是12cm),而不是硬编码的长度值。

\documentclass[12pt,a4paper]{article}
\usepackage{utopia}
\usepackage[demo]{graphicx} % remove "demo" for real doc
\usepackage[font=footnotesize, labelfont=bf,
            format=hang, labelformat=parens,
            labelsep=endash, justification=raggedright,
            singlelinecheck=on]{caption}
\usepackage{subcaption}
\captionsetup[sub]{font=footnotesize,
            labelsep=endash, justification=centering}

\begin{document}
\begin{figure}
\centering
% Create a `minipage` that's 12cm wide
% Then, use `\linewidth` parameter inside the `minipage` environment
\begin{minipage}{12cm}
\begin{subfigure}{\linewidth}
   \includegraphics[width=\linewidth]{W80_32N_Sep_S}
   \caption{Wall no.(80): 32$^\circ$N -- September -- South orientation}
   \label{fig:w80}
\end{subfigure}

\medskip % insert a bit more vertical space between subfigures
\begin{subfigure}{\linewidth}
   \includegraphics[width=\linewidth]{W17_56N_Apr_NE}
   \caption{Wall no.(17): 56$^\circ$N -- April -- NorthEast orientation}
   \label{fig:w17}
\end{subfigure}

\caption{Comparing Corrected CLTDs Resulting from Equations~(\ref{eq:corr})
   and~(\ref{eq:corr_ash}) with the Calculated CLTDs for Two Different Wall
   Constructions, Locations, Months, and Orientations.}
\label{fig:corr}
\end{minipage}
\end{figure}
\end{document}