

我正在使用 Christian Feuersänger 的脚本:
\documentclass{standalone}
\usepackage{colortbl}
\usepackage{pgfplots}
\usepackage{pgfplotstable}

\pgfplotstableset{
    /color cells/min/.initial=0,
    /color cells/max/.initial=1000,
    /color cells/textcolor/.initial=,
    %
    % Usage: 'color cells={min=<value which is mapped to lowest color>,
    %   max = <value which is mapped to largest>}
    color cells/.code={%
        \pgfqkeys{/color cells}{#1}%
        \pgfkeysalso{%
            postproc cell content/.code={%
                %
                \begingroup
                %
                % acquire the value before any number printer changed
                % it:
                \pgfkeysgetvalue{/pgfplots/table/@preprocessed cell content}\value
                \pgfmathfloatparsenumber{\value}%
                \pgfmathfloattofixed{\pgfmathresult}%
                \let\value=\pgfmathresult
                %
                % map that value:
                \pgfplotscolormapaccess
                    [\pgfkeysvalueof{/color cells/min}:\pgfkeysvalueof{/color cells/max}]
                    {\value}
                    {\pgfkeysvalueof{/pgfplots/colormap name}}
                % now, \pgfmathresult contains {<R>,<G>,<B>}
                %
                % acquire the value AFTER any preprocessor or
                % typesetter (like number printer) worked on it:
                \pgfkeysgetvalue{/pgfplots/table/@cell content}\typesetvalue
                \pgfkeysgetvalue{/color cells/textcolor}\textcolorvalue
                %
                % tex-expansion control
                % see http://tex.stackexchange.com/questions/12668/where-do-i-start-latex-programming/27589#27589
                \toks0=\expandafter{\typesetvalue}%
                \xdef\temp{%
                    \noexpand\pgfkeysalso{%
                        @cell content={%
                            \noexpand\cellcolor[rgb]{\pgfmathresult}%
                            \noexpand\definecolor{mapped color}{rgb}{\pgfmathresult}%
                            \ifx\textcolorvalue\empty
                            \else
                                \noexpand\color{\textcolorvalue}%
                            \fi
                            \the\toks0 %
                        }%
                    }%
                }%
                \endgroup
                \temp
            }%
        }%
    }
}

% this is my table:

\pgfplotstabletypeset[
    color cells={min=0.2,max=0.9,textcolor=-mapped color!80!black},
    /pgfplots/colormap/blackwhite,
    /pgf/number format/.cd,%sci,
    set decimal separator={,},
]{
1.0 1.0 1.0 0.9 0.3 0.2 0.6 0.5 0.6 0.5 0.5 0.7 0.1 0.2 0.6
1.0 1.0 1.0 0.9 0.3 0.2 0.6 0.5 0.6 0.5 0.5 0.7 0.1 0.2 0.6
1.0 1.0 1.0 0.9 0.3 0.2 0.6 0.5 0.6 0.5 0.5 0.7 0.1 0.2 0.6
0.9 0.9 0.9 1.0 0.4 0.2 0.4 0.4 0.4 0.3 0.4 0.4 0.1 0.4 0.5
0.3 0.3 0.3 0.4 1.0 0.0 0.3 0.2 0.3 0.2 0.3 0.2 0.4 0.4 0.0
0.2 0.2 0.2 0.2 0.0 1.0 0.5 0.4 0.5 0.4 0.1 0.4 0.1 0.0 0.2
0.6 0.6 0.6 0.4 0.3 0.5 1.0 1.0 1.0 0.9 0.7 0.7 0.2 0.1 0.4
0.5 0.5 0.5 0.4 0.2 0.4 1.0 1.0 1.0 1.0 0.5 0.6 0.1 0.0 0.3
0.6 0.6 0.6 0.4 0.3 0.5 1.0 1.0 1.0 0.9 0.6 0.7 0.2 0.1 0.4
0.5 0.5 0.5 0.3 0.2 0.4 0.9 1.0 0.9 1.0 0.5 0.5 0.1 0.0 0.3
0.5 0.5 0.5 0.4 0.3 0.1 0.7 0.5 0.6 0.5 1.0 0.9 0.1 0.1 0.2
0.7 0.7 0.7 0.4 0.2 0.4 0.7 0.6 0.7 0.5 0.9 1.0 0.3 0.2 0.2
0.1 0.1 0.1 0.1 0.4 0.1 0.2 0.1 0.2 0.1 0.1 0.3 1.0 0.9 0.4
0.2 0.2 0.2 0.4 0.4 0.0 0.1 0.0 0.1 0.0 0.1 0.2 0.9 1.0 0.1
0.6 0.6 0.6 0.5 0.0 0.2 0.4 0.3 0.4 0.3 0.2 0.2 0.4 0.1 1.0
}
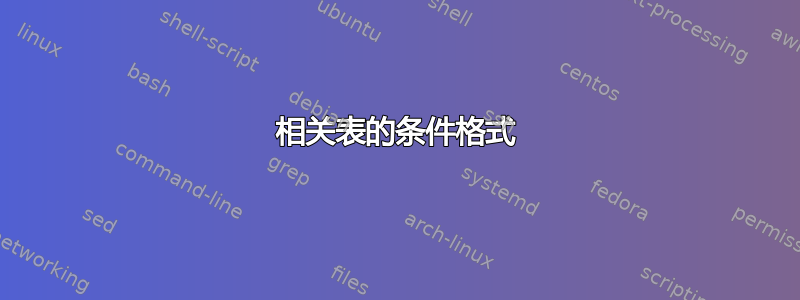
结果如下:

现在我必须将其打印成黑白格式,但有些单元格中的文本却看不见。应该如何更改脚本,才能使文本在非白色背景下变为白色,而在白色单元格中保持文本颜色为黑色?
答案1
最简单的方法可能是简单地检查值是否大于或小于,0.5并相应地设置两种颜色之一:
\ifdim\value pt<.5pt\relax
  \def\textcolorvalue{white}%
\else
  \def\textcolorvalue{black}% or {} as the default color will be used if none is set
\fi
代码
\documentclass[convert=false,varwidth]{standalone}
\usepackage{colortbl}
\usepackage{pgfplots}
\usepackage{pgfplotstable}

\pgfplotstableset{
    /color cells/min/.initial=0,
    /color cells/max/.initial=1000,
    /color cells/textcolor/.initial=,
    %
    % Usage: 'color cells={min=<value which is mapped to lowest color>,
    %   max = <value which is mapped to largest>}
    color cells/.code={%
        \pgfqkeys{/color cells}{#1}%
        \pgfkeysalso{%
            postproc cell content/.code={%
                %
                \begingroup
                %
                % acquire the value before any number printer changed
                % it:
                \pgfkeysgetvalue{/pgfplots/table/@preprocessed cell content}\value
                \pgfmathfloatparsenumber{\value}%
                \pgfmathfloattofixed{\pgfmathresult}%
                \let\value=\pgfmathresult
                %
                % map that value:
                \pgfplotscolormapaccess
                    [\pgfkeysvalueof{/color cells/min}:\pgfkeysvalueof{/color cells/max}]
                    {\value}
                    {\pgfkeysvalueof{/pgfplots/colormap name}}
                % now, \pgfmathresult contains {<R>,<G>,<B>}
                %
                % acquire the value AFTER any preprocessor or
                % typesetter (like number printer) worked on it:
                \pgfkeysgetvalue{/pgfplots/table/@cell content}\typesetvalue
%                \pgfkeysgetvalue{/color cells/textcolor}\textcolorvalue
                \ifdim\value pt<.5pt\relax
                  \def\textcolorvalue{white}%
                \else
                  \def\textcolorvalue{black}%
                \fi
                %
                % tex-expansion control
                % see http://tex.stackexchange.com/questions/12668/where-do-i-start-latex-programming/27589#27589
                \toks0=\expandafter{\typesetvalue}%
                \xdef\temp{%
                    \noexpand\pgfkeysalso{%
                        @cell content={%
                            \noexpand\cellcolor[rgb]{\pgfmathresult}%
                            \noexpand\definecolor{mapped color}{rgb}{\pgfmathresult}%
                            \ifx\textcolorvalue\empty
                            \else
                                \noexpand\color{\textcolorvalue}%
                            \fi
                            \the\toks0 %
                        }%
                    }%
                }%
                \endgroup
                \temp
            }%
        }%
    }
}

% this is my table:
\begin{document}
\pgfplotstabletypeset[
    color cells={min=0.2,max=0.9,textcolor=-mapped color!80!black},
    /pgfplots/colormap/blackwhite,
    /pgf/number format/.cd,%sci,
    set decimal separator={,},
]{
1.0 1.0 1.0 0.9 0.3 0.2 0.6 0.5 0.6 0.5 0.5 0.7 0.1 0.2 0.6
1.0 1.0 1.0 0.9 0.3 0.2 0.6 0.5 0.6 0.5 0.5 0.7 0.1 0.2 0.6
1.0 1.0 1.0 0.9 0.3 0.2 0.6 0.5 0.6 0.5 0.5 0.7 0.1 0.2 0.6
0.9 0.9 0.9 1.0 0.4 0.2 0.4 0.4 0.4 0.3 0.4 0.4 0.1 0.4 0.5
0.3 0.3 0.3 0.4 1.0 0.0 0.3 0.2 0.3 0.2 0.3 0.2 0.4 0.4 0.0
0.2 0.2 0.2 0.2 0.0 1.0 0.5 0.4 0.5 0.4 0.1 0.4 0.1 0.0 0.2
0.6 0.6 0.6 0.4 0.3 0.5 1.0 1.0 1.0 0.9 0.7 0.7 0.2 0.1 0.4
0.5 0.5 0.5 0.4 0.2 0.4 1.0 1.0 1.0 1.0 0.5 0.6 0.1 0.0 0.3
0.6 0.6 0.6 0.4 0.3 0.5 1.0 1.0 1.0 0.9 0.6 0.7 0.2 0.1 0.4
0.5 0.5 0.5 0.3 0.2 0.4 0.9 1.0 0.9 1.0 0.5 0.5 0.1 0.0 0.3
0.5 0.5 0.5 0.4 0.3 0.1 0.7 0.5 0.6 0.5 1.0 0.9 0.1 0.1 0.2
0.7 0.7 0.7 0.4 0.2 0.4 0.7 0.6 0.7 0.5 0.9 1.0 0.3 0.2 0.2
0.1 0.1 0.1 0.1 0.4 0.1 0.2 0.1 0.2 0.1 0.1 0.3 1.0 0.9 0.4
0.2 0.2 0.2 0.4 0.4 0.0 0.1 0.0 0.1 0.0 0.1 0.2 0.9 1.0 0.1
0.6 0.6 0.6 0.5 0.0 0.2 0.4 0.3 0.4 0.3 0.2 0.2 0.4 0.1 1.0
}
\end{document}
输出
