

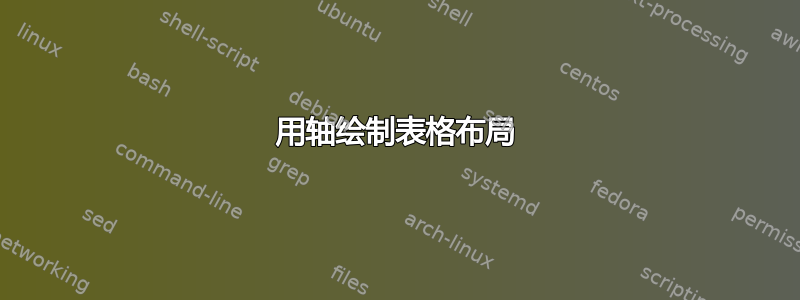
我需要绘制一个像下面这样的集装箱舱位布局。我对 TIKZ 完全不熟悉。

您可以将其视为一种带有轴的表格。两个轴的大小都可变,数字最好从 1 开始,而不是从 0 开始。我需要经常创建这样的布局,因此创建一个接受如下输入的模板
{}{6}{3,9,0}{5}{4,1,2,7}{8}
会很好。您可以以不同的方式构造它,但您明白我的意思。框将始终包含数字 0-99,没有文本。
此外,您能否描述一下如何编辑其中一个框,使其变为阴影(灰色)、划掉(背景中的对角线)。我会在新问题中提出这个问题,但这与您用来绘制的元素类型密切相关。
答案1
一种可能的解决方案。要点:双重 foreach 并通过恰当的名称跟踪块。
\documentclass[tikz,border=10pt]{standalone}
\usepackage{tikz}
\usetikzlibrary{backgrounds,calc,patterns}

\tikzset{container/.style={
   draw,
   minimum size=1cm,
   anchor=south west
 },
 bg box/.style={
   container,
   anchor=center
 }
}

\newcommand{\containerbay}[1]{
 \foreach \x[count=\xi from 0] in {#1}{
   \foreach \y[count=\yi from 0] in \x{
      \node[container] (box-\xi-\yi) at (\xi,\yi){\y};
   }
 }
}

\newcommand{\drawxaxes}[1]{
 \draw (0,0) -- (#1,0);
 \foreach \x[remember=\x as \lastx] in {0,1,...,#1}{
   \ifnum\x>0
     \draw[xshift=0.5\pgflinewidth] (\x,0)--(\x,-0.1);
     \node[below] at ($(\x,0)-(0.5,0)$) {\lastx};
   \fi
 }
}

\newcommand{\drawyaxes}[1]{
 \draw (0,0) -- (0,#1);
 \foreach \y[remember=\y as \lasty] in {0,1,...,#1}{
   \ifnum\y>0
     \draw (0.1,\y)--(-0.1,\y);
     \node[left] at ($(0,\y)-(0,0.5)$) {\lasty};
   \fi
 }
}

\begin{document}
\begin{tikzpicture}
\drawxaxes{6}
\drawyaxes{4}
\containerbay{{},{6},{3,9,0},{5},{4,{},2,7},{8}}% use {} for void elements

% customization: each block is identified by the name "box-<row>-<column>"
\begin{scope}[on background layer,bg box]% style bg box for background
\node[fill=blue!20] at (box-1-0){};
\node[top color=green!1,bottom color=green!50!lime!50] at (box-2-1){};
\node[pattern=north west lines, pattern color=red!40] at (box-3-0){};
\node[inner color=green!1,outer color=magenta!50!violet!50] at (box-4-1){};
\node[pattern=crosshatch, pattern color=orange!60] at (box-4-3){};
\end{scope}
\end{tikzpicture}
\end{document}
结果:

答案2
这是另一个寻求帮助的替代解决方案pgfplotstable,并准备了数字表以供读入,数字 100 表示不需要盒子,而 0-99 是盒子的数字。该解决方案还假设每个数字都有通过定义指定的颜色。

代码
\documentclass[border=1cm]{standalone}
\usepackage{pgfplotstable}
\usepackage{tikz}
\usetikzlibrary{positioning}

\pgfplotstableread[col sep=comma]{%
100, 100, 100, 100,   7, 100
100, 100,   0, 100,   2, 100
100, 100,   9, 100,   1, 100
100,   6,   3,   5,   4,   8
}\mycolor
\newcommand\m{4}  % number of rows
\newcommand\n{6}  % number of columns
\definecolor{c0}{HTML}{54FF00}
\definecolor{c1}{HTML}{BBFFFF}
\definecolor{c2}{HTML}{FF0000}
\definecolor{c3}{HTML}{0048FF}
\definecolor{c4}{HTML}{54FFAA}
\definecolor{c5}{HTML}{1FFFFF}
\definecolor{c6}{HTML}{FF00AA}
\definecolor{c7}{HTML}{0048FE}
\definecolor{c8}{HTML}{0048FC}
\definecolor{c9}{HTML}{AAFFFF}

\begin{document}


\begin{tikzpicture}
    \foreach \x[count=\xi from 0] in {1,...,\n}{
        \foreach \y[count=\yi from 0] in {1,...,\m}{
           \begin{scope}[shift={(-1,4)}] % for alignment of x-y axis
            \pgfplotstablegetelem{\yi}{\xi}\of{\mycolor}
            \ifnum\pgfplotsretval = 100
            \path[shift={(\x,-\y)}] (0,0) rectangle (1,1);
            \else
            \draw[shift={(\x,-\y)},fill=c\pgfplotsretval] (0,0) rectangle (1,1) node[xshift=-0.5cm,yshift=-0.5cm]{\pgfplotsretval};
            \fi
            \end{scope}
            \draw[thick](\x,2pt)--(\x,-2pt) (\xi,0)--(\x,0)node[midway,below]{\xi};
            \draw[thick](2pt,\y)--(-2pt,\y) (0,\yi)--(0,\y)node[midway,left]{\yi};
        }
    }
\end{tikzpicture}
\end{document}
答案3
通过 MetaPost 提供的解决方案,其仅限于 OP 的愿望(灰色阴影,用对角线绘制阴影)。
主宏table_looking_layout接受两个无限参数:每个垂直条的高度(或每个条中的方块数)和每个方块内的数字,并使用它们的数字绘制这些条。此宏还检查高度总和是否等于方块数。
另外两个宏fill_with_shade和fill_with_hatching,正如其名称所暗示的那样,分别使用作为第一个参数给出的灰色阴影和阴影线来填充作为第二个参数给出的方块列表。
使用 metafun 格式运行:
mpost --mem=metafun file.mp
希望有帮助…
input latexmp; input hatching;
setupLaTeXMP(options="12pt", textextlabel=enable, mode=rerun);
u := 1.5cm;

numeric N[][]; path P[][];

% Main macro. First argument: height of the successive bars.
% Second argument: the numbers inside
vardef table_looking_layout (text s) (text t) =

save i, j, k, total, number, nb_bars, height_bar, height_bar_max;

i = 0;
height_bar_max = 0;
for $ = s:
   i := i+1;
   height_bar[i] = $;
   if height_bar_max < $: height_bar_max := $; fi;
endfor;
nb_bars = i;

j = 0;
for $ = t:
   j := j+1;
   number[j] = $;
endfor;
total = j;

% Draw the bars, check before if arguments are coherent (else does nothing)
if total = height_bar[1] for l = 2 upto nb_bars: + height_bar[l] endfor:
   k = 0;
   for m = 1 upto nb_bars:
      for n = 1 upto height_bar[m]:
         k := k+1;
         P[m][n] := (m-1, n-1)*u -- (m-1, n)*u -- (m, n)*u -- (m, n-1)*u -- cycle;
         unfill P[m][n]; draw P[m][n];
         N[m][n] := number[k];
         label(decimal N[m][n], center P[m][n]);
      endfor;
   endfor;
   draw origin -- (nb_bars*u, 0) withcolor white; draw origin -- (nb_bars*u, 0);
   draw origin -- (0, height_bar_max)*u withcolor white; draw origin -- (0, height_bar_max)*u;
   for m = 1 upto nb_bars:
      label.bot(decimal m, (0.5[m-1, m]*u, 0));
   endfor;
   for n = 1 upto height_bar_max:
      draw (-3bp, n*u) -- (3bp, n*u);
      label.lft(decimal n, (0, 0.5[n-1, n]*u));
   endfor;
else:
   label("Data error!", origin);
fi;
enddef;

% fill list t of squares (bar x, height y) with color c
def fill_with_shade(expr c)(text t) =
for z = t:
   x := xpart z; y:= ypart z;
   fill P[x][y] withcolor c; draw P[x][y]; label(decimal N[x][y], center P[x][y]);
endfor;
enddef;

% fill list t of squares (bar x, height y) with hatching c
def fill_with_hatching(expr c)(text t) =
for z = t:
   x := xpart z; y:= ypart z;
   unfill P[x][y]; hatchfill P[x][y] withcolor c; draw P[x][y];
   unfill boundingbox thelabel(decimal N[x][y], center P[x][y]) enlarged 1bp;
   label(decimal N[x][y], center P[x][y]);
endfor;
enddef;

beginfig(1);
% OP's Example
table_looking_layout (1, 3, 1, 4, 1) (6, 3, 9, 0, 5, 4, 1, 2, 7, 8);
fill_with_shade(0.8white, (2, 2), (3, 1), (4, 3));
fill_with_hatching((45, 1mm, -0.5bp), (1, 1), (4, 2));
endfig;
end.
