

作为后续问题根据与另一个图形的交点填充图形下的区域,我希望创建以下效果:
- 根据两个图形交点的坐标进行填充。
- 图表堆叠在一起,因此
normal-曲线下方但位于两张图之间(在 下方normal但在 上方skew)的面积应为cyan!20。另一条曲线下方的面积应为green!20。 - 没有任何图形异常......问题是,图形的第一个交点在动画中消失,并且
intersection segments关键点完全是静态的(它将总是使用第 n 条路径的第 n 个交点,混蛋!)。
我摆弄了一下domain密钥,但结果却令人非常失望。:-(
我只能在特定点重现预期结果,而不能重现整个动画:

Christian Feuersänger 怀疑存在错误,因此我将原始动画代码向下移动。
\documentclass{article}
\usepackage{tikz,pgfplots}
\pgfplotsset{compat=newest}
\usepgfplotslibrary{fillbetween}
\usetikzlibrary{intersections}
\usepackage{animate}
\pgfmathdeclarefunction{normal}{2}{%
  \pgfmathparse{1/(#2*sqrt(2*pi))*exp(-((x-#1)^2)/(2*#2^2))}%
}
\makeatletter
\pgfmathdeclarefunction{erf}{1}{%
  \begingroup
    \pgfmathparse{#1 > 0 ? 1 : -1}%
    \edef\sign{\pgfmathresult}%
    \pgfmathparse{abs(#1)}%
    \edef\x{\pgfmathresult}%
    \pgfmathparse{1/(1+0.3275911*\x)}%
    \edef\t{\pgfmathresult}%
    \pgfmathparse{%
      1 - (((((1.061405429*\t -1.453152027)*\t) + 1.421413741)*\t
      -0.284496736)*\t + 0.254829592)*\t*exp(-(\x*\x))}%
    \edef\y{\pgfmathresult}%
    \pgfmathparse{(\sign)*\y}%
    \pgfmath@smuggleone\pgfmathresult%
  \endgroup
}
\makeatother
\pgfmathdeclarefunction{skew}{3}{%
        \pgfmathparse{(exp(-((x-#1)^2)/(2*(#2)^2))*((erf((#3*(x-#1))/(sqrt(2)*#2)))+1))/(sqrt(2*pi)*#2)}%
}
\begin{document}
\begin{tikzpicture}
\begin{axis}[
      hide y axis,
      axis lines*=center,
      axis on top,
      no markers,
      domain=-1:18,
      samples=20,
      xlabel=\empty,
      ylabel=\empty,
      every axis x label/.style={at=(current axis.right of origin),anchor=west},
      every axis y label/.style={at=(current axis.above origin),anchor=south},
      height=5cm, width=12cm,
      xmin = -1, xmax=18,
      xtick=, ytick=\empty,
      enlargelimits=false,
      clip=false
  ]
  \addplot [name path=normal,very thick,cyan!85!black!50] {normal(10,3.416969)};
  \addplot [name path=skew,very thick,red!85!black!50] {skew(1,4,10)};
  \path [name path=lower, name intersections={of=skew and normal}, intersection segments={of=skew and normal,sequence=B1 -- A2}];
  \path[name path=axis]
(axis cs:\pgfkeysvalueof{/pgfplots/xmin},0) --
(axis cs:\pgfkeysvalueof{/pgfplots/xmax},0);
  \addplot [draw=green!80,fill=green!20] fill between [of=lower and axis, soft clip={(intersection-2) rectangle (axis cs:\pgfkeysvalueof{/pgfplots/xmax},0)}];
\end{axis}
\end{tikzpicture}
\end{document}
\documentclass{article}
\usepackage{tikz,pgfplots}
\pgfplotsset{compat=newest}
\usepgfplotslibrary{fillbetween}
\usetikzlibrary{intersections}
%\usetikzlibrary{calc}
\usepackage{animate}
%\usepackage{fp}
\pgfmathdeclarefunction{normal}{2}{%
  \pgfmathparse{1/(#2*sqrt(2*pi))*exp(-((x-#1)^2)/(2*#2^2))}%
}
\makeatletter
\pgfmathdeclarefunction{erf}{1}{%
  \begingroup
    \pgfmathparse{#1 > 0 ? 1 : -1}%
    \edef\sign{\pgfmathresult}%
    \pgfmathparse{abs(#1)}%
    \edef\x{\pgfmathresult}%
    \pgfmathparse{1/(1+0.3275911*\x)}%
    \edef\t{\pgfmathresult}%
    \pgfmathparse{%
      1 - (((((1.061405429*\t -1.453152027)*\t) + 1.421413741)*\t
      -0.284496736)*\t + 0.254829592)*\t*exp(-(\x*\x))}%
    \edef\y{\pgfmathresult}%
    \pgfmathparse{(\sign)*\y}%
    \pgfmath@smuggleone\pgfmathresult%
  \endgroup
}
\makeatother
\pgfmathdeclarefunction{skew}{3}{%
        \pgfmathparse{(exp(-((x-#1)^2)/(2*(#2)^2))*((erf((#3*(x-#1))/(sqrt(2)*#2)))+1))/(sqrt(2*pi)*#2)}%
}
\newcommand*{\power}[1]{
\begin{tikzpicture}
\begin{axis}[
      hide y axis,
      axis lines*=center,
      axis on top,
      no markers,
      domain=-1:18,
      samples=20,
      xlabel=\empty,
      ylabel=\empty,
      every axis x label/.style={at=(current axis.right of origin),anchor=west},
      every axis y label/.style={at=(current axis.above origin),anchor=south},
      height=5cm, width=12cm,
      xmin = -1, xmax=18,
      xtick=, ytick=\empty,
      enlargelimits=false,
      clip=false
  ]
  \addplot [name path=normal,very thick,cyan!85!black!50] {normal(0.125*#1,3.416969)};
  \addplot [name path=skew,very thick,red!85!black!50] {skew(1,4,10)};
  \path [name path=lower, name intersections={of=skew and normal}, intersection segments={of=skew and normal,sequence=B1 -- A2}];
  \path[name path=axis]
(axis cs:\pgfkeysvalueof{/pgfplots/xmin},0) --
(axis cs:\pgfkeysvalueof{/pgfplots/xmax},0);
  \addplot [draw=cyan!80,fill=cyan!20, stack plots=y] fill between [of=normal and skew,domain=(intersection-2):\pgfkeysvalueof{/pgfplots/xmax}] ;
  \addplot [draw=green!80,fill=green!20, stack plots=y] fill between [of=lower and axis, soft clip={(intersection-2) rectangle (axis cs:\pgfkeysvalueof{/pgfplots/xmax},0)}];
\end{axis}
\end{tikzpicture}
}
\begin{document}
\begin{animateinline}[controls,loop,palindrome]{32}
  \multiframe{94}{ik=32+1}{
    \power{\ik}
    }
    \end{animateinline}
\end{document}
答案1
这是 tikz 库中的一个错误,intersections一旦我们显示所有交叉节点,它就会变得明显:
\documentclass{standalone}
\usepackage{tikz,pgfplots}
\pgfplotsset{compat=newest}
\usepgfplotslibrary{fillbetween}
\usetikzlibrary{intersections}
\pgfmathdeclarefunction{normal}{2}{%
\pgfmathparse{1/(#2*sqrt(2*pi))*exp(-((x-#1)^2)/(2*#2^2))}%
}
\makeatletter
\pgfmathdeclarefunction{erf}{1}{%
\begingroup
\pgfmathparse{#1 > 0 ? 1 : -1}%
\edef\sign{\pgfmathresult}%
\pgfmathparse{abs(#1)}%
\edef\x{\pgfmathresult}%
\pgfmathparse{1/(1+0.3275911*\x)}%
\edef\t{\pgfmathresult}%
\pgfmathparse{%
1 - (((((1.061405429*\t -1.453152027)*\t) + 1.421413741)*\t
-0.284496736)*\t + 0.254829592)*\t*exp(-(\x*\x))}%
\edef\y{\pgfmathresult}%
\pgfmathparse{(\sign)*\y}%
\pgfmath@smuggleone\pgfmathresult%
\endgroup
}
\pgfmathdeclarefunction{skew}{3}{%
\pgfmathparse{(exp(-((x-#1)^2)/(2*(#2)^2))*((erf((#3*(x-#1))/(sqrt(2)*#2)))+1))/(sqrt(2*pi)*#2)}%
}
\begin{document}
\begin{tikzpicture}
\begin{axis}[
hide y axis,
axis lines*=center,
axis on top,
no markers,
domain=-1:18,
samples=20,
xlabel=\empty,
ylabel=\empty,
every axis x label/.style={at=(current axis.right of origin),anchor=west},
every axis y label/.style={at=(current axis.above origin),anchor=south},
height=5cm, width=12cm,
xmin = -1, xmax=18,
xtick=, ytick=\empty,
enlargelimits=false,
clip=false
]
\addplot [name path=normal,very thick,cyan!85!black!50] {normal(10,3.416969)};
\addplot [name path=skew,very thick,red!85!black!50] {skew(1,4,10)};
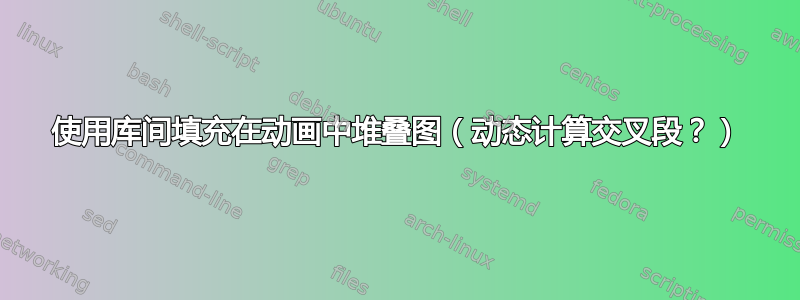
\path [name intersections={of=skew and normal},font=\tiny]
node[draw] at (intersection-1) {1/\pgfintersectionsolutions}
node[draw] at (intersection-2) {2/\pgfintersectionsolutions}
node[draw] at (intersection-3) {3/\pgfintersectionsolutions}
;
\end{axis}
\end{tikzpicture}
\end{document}

显然,节点 1/3 根本不应该存在。
不幸的是,这使得很难找到合适的解决方法:如果您修改代码以使其使用节点 3 而不是 2,则一旦您收到包含修复的新版本的 TikZ,您的示例将无法编译。