

我确实需要一个快速建议来处理 sdaau 给出的答案。请参阅这问题。实际上,我对给定的解决方案有一个后续问题。
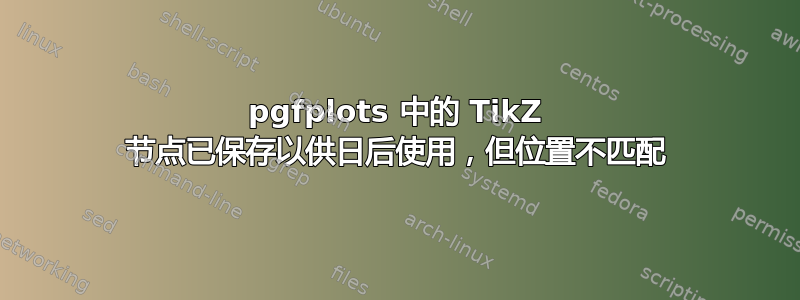
这实际上运行得很好,但坐标有点偏差。请看屏幕截图。我无法更接近绘制的点。我当然想直接从生成的节点绘制。它们似乎位于预期的位置,从橙色圆圈可以看出。使用此代码有什么问题(因为在设置 MWE 后它现在也无法编译)?
% !TEX TS-program = pdflatex
% !TEX encoding = UTF-8 Unicode

\documentclass[tikz]{standalone}
\usepackage{pgfplots}
\pgfplotsset{compat=newest}
\usetikzlibrary{plotmarks, calc, intersections}
\usepackage{amsmath}

\begin{document}
\begin{tikzpicture}


\begin{axis}[%
    width=10cm,
    height=10cm,
    axis x line = middle,
    axis y line = middle,
    scale only axis,
    xlabel={x [mm]},
    ylabel={y [mm]},
    title={$\text{n}_{\text{iterations}}\text{= 2}$}
]


\addplot+[
  only marks,
  mark=text,
  text mark={\coordindex}, % empty for now; try also \coordindex
  text mark as node=true,
  text mark style={%
    name=p\coordindex,
    color=orange,
    shape=circle,
    draw,
    inner sep=0pt,
    minimum size=0pt,
    align=center,
    text width=5pt,
    text depth=0pt
  }
]
  table{%
        0         0
      -79.9393  236.8749
      143.0014  350.0007
      200.0014  350.0000
      200.0008  300.0000
    };
    \pgfplotsextra{
         % In this case, you get the point that is <dimension> away from <p> on the straight line to <q>:  ($(p)!dimension!(q)$)
        \path [name path=P--C-ext] (p0) -- ($(p1)!-50!(p0)$);
        \draw (p0) -- (p1);
        \path [name path=Rim] (p1.center) circle(50);
        \path [draw, name intersections={of=P--C-ext and Rim}];

        \pgfmathanglebetweenpoints{%
                \pgfpointanchor{p1}{center}
        }{%
                \pgfpointanchor{intersection-1}{center}
        }
        \let\myendresult\pgfmathresult

        \fill [fill=blue!50,draw=blue,thin,opacity=0.5] (p1) -- (intersection-1) arc [start angle=\myendresult,delta angle=-40,radius=50] -- cycle;
        \fill [fill=blue!50,draw=blue,thin,opacity=0.5] (p1) -- (intersection-1) arc [start angle=\myendresult,delta angle=25,radius=50] -- cycle;
    };

\end{axis}

\end{tikzpicture}

\end{document}

答案1
\documentclass[tikz]{standalone}
\usepackage{pgfplots}
\pgfplotsset{compat=newest}
\usetikzlibrary{plotmarks, calc, intersections}
\usepackage{amsmath}

\newlength{\radius}

\begin{document}
\begin{tikzpicture}


\begin{axis}[%
    width=10cm,
    height=10cm,
    axis x line = middle,
    axis y line = middle,
    scale only axis,
    xlabel={x [mm]},
    ylabel={y [mm]},
    title={$\text{n}_{\text{iterations}}\text{= 2}$}
]

\addplot+[
  only marks,
  mark=text,
  text mark={\coordindex}, % empty for now; try also \coordindex
  text mark as node=true,
  text mark style={%
    name=p\coordindex,
    color=orange,
    shape=circle,
    draw,
    inner sep=0pt,
    minimum size=0pt,
    align=center,
    text width=5pt,
    text depth=0pt
  }
]
  table{%
        0         0
      -79.9393  236.8749
     143.0014  350.0007
     200.0014  350.0000
      200.0008  300.0000
    };

\coordinate (R) at (50,50);% store radius as coordinate
\end{axis}

\pgfextractx{\radius}{\pgfpointanchor{R}{center}}

\coordinate (pext) at ($(p1)!-\radius!(p0)$);
\draw (p0) -- (p1) (p1) -- (pext);

\pgfmathanglebetweenpoints{\pgfpointanchor{p0}{center}}%
  {\pgfpointanchor{p1}{center}}
\let\myendresult\pgfmathresult

\fill [fill=blue!50,draw=blue,thin,opacity=0.5] (p1) -- (pext) arc [start angle=\myendresult,delta angle=-40,radius=\radius] -- cycle;
\fill [fill=blue!50,draw=blue,thin,opacity=0.5] (p1) -- (pext) arc [start angle=\myendresult,delta angle=25,radius=\radius] -- cycle;

\end{tikzpicture}

\end{document}
