

我想向你展示我的问题。这里有生成图片的脚本。现在我需要生成第二张图片,其中箭头不再等距。
\documentclass[letterpaper,11pt]{article}
\usepackage{amsmath}
\usepackage{amsfonts}
\usepackage{tikz} %for drawings
\usetikzlibrary{shapes}
\usetikzlibrary{arrows}
\usetikzlibrary{calc}
\usepackage{pgfplots}
\usepackage{tkz-fct} %for functions
\usepackage[hmargin=1in,vmargin=1in]{geometry}
\begin{document}
\begin{figure}[h]
\begin{center}
\begin{tikzpicture}[
every path/.style = {},
every node/.append style = {font=\sffamily}
]
% Store points unrolled
\foreach \x in {0,30,60,...,330}
{
\node at (\x /30 , 0) (P1\x) {};
\node at (\x /30+ 1,0) (P2\x) {};
\draw[lightgray] (P1\x) -- (P2\x) {};
};
% Store vorticity points
\foreach \x in {0,30,60,...,330}
{
\node at ($(P1\x)!1cm+0.6cm*sin(\x)!90:(P1\x)$) (V1\x) {};
\node at ($(P2\x)!1cm+0.6cm*sin(\x+30)!270:(P2\x)$) (V2\x) {};
};
% Draw the vorticity distribution
\foreach \x in {0,30,60,...,330}
{
\draw[very thick, <-] (V1\x) -- (P1\x) node(xline)[right] {};
\draw[very thick, <-] (V2\x) -- (P2\x) node(xline)[right] {};
\draw[lightgray] (V1\x) -- (V2\x) node(xline)[right] {};
\draw[lightgray] (V1\x) -- (V2\x) node(xline)[right] {};
}
\end{tikzpicture}
\end{center}
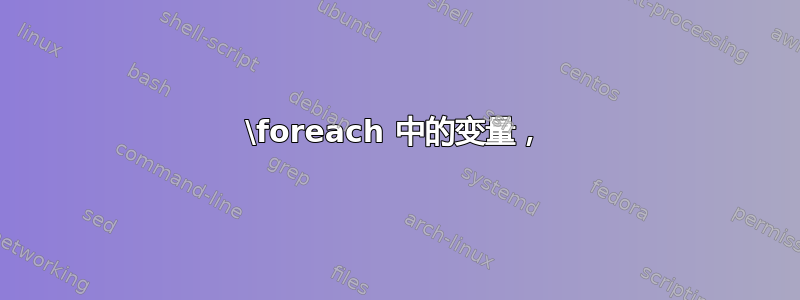
\caption{An example of vorticiy distribution along the N panels when the geometry is unrolled}
\label{Vorticity_distribution_unrolled}
\end{figure}
\end{document}
是否有人能够生成一个描述相同函数 f=f(\x) 的图形,但在箭头较高的地方具有更高的箭头密度?
我希望这个问题能够更容易理解。
非常感谢。
达里奥
答案1
根据符号 1 的答案,我开发了以下内容,其中箭头密度更高,箭头更高而不是随机。
\documentclass[border=9,tikz]{standalone}

\begin{document}
\begin{tikzpicture}[shorten <=2,shorten >=2]
    \coordinate (A) at (0, 0);
    \coordinate (B) at (0, 1);
    \draw[->] (A) -- (B);
    \foreach \i [evaluate={\x=\lastx+0.25-(\lasty-1)/3}, evaluate={\y=1+sin(72*\x)/4}, remember=\x as \lastx (initially 0), remember=\y as \lasty (initially 1)] in {1, ..., 60} {
        \coordinate (C) at (\x, 0);
        \coordinate (D) at (\x, {\y});
        \draw[->] (C) -- (D);
        \draw[gray] (A) -- (C) coordinate (A);
        \draw[gray] (B) -- (D) coordinate (B);
    }
\end{tikzpicture}
\end{document}

有关\foreach命令的更多信息,请参阅tikz 文档VII.83 节“重复的事情:Foreach 语句”。第 904 页描述了自定义 foreach 语句的选项。
答案2
\documentclass[border=9,tikz]{standalone}

\begin{document}
\tikz[shorten <=2,shorten >=2]{
    \draw[->](0,0)coordinate(A)
             (0,1)coordinate(B)
             (A)->(B);
    \foreach\i[evaluate={\x=\i/4-rnd/10;}]in{1,...,20}{
        \draw[->](\x,0)coordinate(C)
                 (\x,{1+sin(72*\x)/4})coordinate(D)
                 (C)->(D);
        \draw[gray](A)--(C)coordinate(A);
        \draw[gray](B)--(D)coordinate(B);
    }
}
\end{document}
