

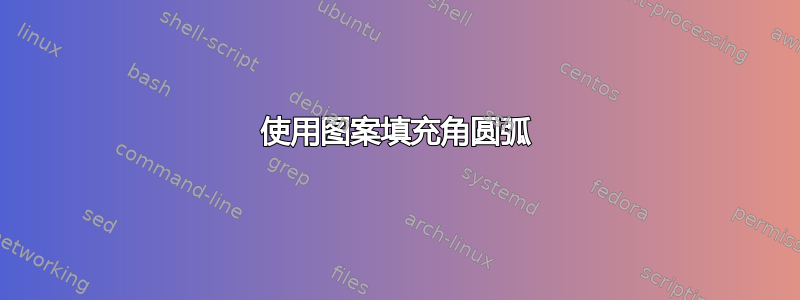
考虑一个平面上的角,其顶点为 O,起始边为 (射线 1),终止边为 (射线 2)。假设该角的度数小于 360 度。(有两个这样的角。)考虑另一条射线(射线 3),其顶点为 O,可在射线 1 和射线 2 之间以 O 为中心旋转。我想使用填充图案遮蔽射线 3 扫过的区域。有两种可能性。
(1)逆时针旋转
(2)顺时针旋转
在阅读了几个问题和答案之后(在 pgfplots 上的 tex.sx 上),我对可能性 (1) 有一个合理可接受的答案。(参见下图和代码。)(请随意改进对第一个可能性的答案。)
\documentclass[11pt]{article}
\usepackage{pgfplots}
\pgfplotsset{compat=1.7}
\usepgfplotslibrary{fillbetween}
\usetikzlibrary{patterns}
\begin{document}

\pgfdeclarepatternformonly[\LineSpace]{my north west lines}{\pgfqpoint{-1pt}{-1pt}}{\pgfqpoint{\LineSpace}{\LineSpace}}{\pgfqpoint{\LineSpace}{\LineSpace}}%
{
    \pgfsetlinewidth{0.4pt}
    \pgfpathmoveto{\pgfqpoint{0pt}{\LineSpace}}
    \pgfpathlineto{\pgfqpoint{\LineSpace + 0.1pt}{-0.1pt}}
    \pgfusepath{stroke}
}

\newdimen\LineSpace
\tikzset{
    line space/.code={\LineSpace=#1},
    line space=3pt
}

\begin{tikzpicture}

\begin{axis}[hide axis, xmin=-1, ymin=-1, xmax=10,ymax=10,
disabledatascaling]

\addplot[domain=0:10,samples=300]
{0};
\addplot[domain=0:6,samples=300]
{x};

\addplot[red,domain=0:7,samples=300]
{x/2};

\addplot[domain=0:9,samples=300,name path=A]
{0};
\addplot[domain=0:4,samples=300,name path=B]
{x};
\addplot[line space=5pt, pattern= my north west lines] fill between[of=A and B];
\draw [red, line width=2pt, ->] (axis cs:2,0) arc [radius=2, start angle=0,end angle=45];
\end{axis}
\end{tikzpicture}
\end{document}

有可能得到第二种可能性的答案吗?

注意:我想对角度内的区域进行阴影处理,以便阴影区域的边界具有某种模糊的形状。(绝对不是圆形。)我没能通过我发布的图片传达这个想法。但是,我可能能够通过剪辑的想法得到一些合理的结果。

答案1
另一种选择是基于现有代码clip在环境中使用。scope

代码:
\documentclass[border=10pt]{standalone}%[11pt]{article}
\usepackage{pgfplots}
\pgfplotsset{compat=newest}
\usepgfplotslibrary{fillbetween}
\usepackage{xcolor}
\usetikzlibrary{patterns}
\begin{document}

\pgfdeclarepatternformonly[\LineSpace]{my north west lines}{\pgfqpoint{-1pt}{-1pt}}{\pgfqpoint{\LineSpace}{\LineSpace}}{\pgfqpoint{\LineSpace}{\LineSpace}}%
{
    \pgfsetlinewidth{0.4pt}
    \pgfpathmoveto{\pgfqpoint{0pt}{\LineSpace}}
    \pgfpathlineto{\pgfqpoint{\LineSpace + 0.1pt}{-0.1pt}}
    \pgfusepath{stroke}
}

\newdimen\LineSpace
\tikzset{
    line space/.code={\LineSpace=#1},
    line space=3pt
}

\begin{tikzpicture}

\begin{axis}[hide axis, xmin=-10, ymin=-10, xmax=10,ymax=10,
disabledatascaling]

\addplot[domain=0:10,samples=300]
{0};
\addplot[domain=0:6,samples=300]
{x};
\addplot[red,domain=0:7,samples=300]
{x/2};

\addplot[domain=0:9,samples=300,name path=A]
{0};
\addplot[domain=0:4,samples=300,name path=B]
{x};
\begin{scope}
\clip[] (0:0)--(0:4) arc (0:-315:4);
\fill [line space=3pt,pattern= north east lines,pattern color=blue] (0,0) circle (2cm);
\end{scope}
\addplot[line space=5pt, pattern= my north west lines] fill between[of=A and B];
\draw [red, line width=2pt, ->] (axis cs:2,0) arc [radius=2, start angle=0,end angle=45];
\draw [blue, line width=1pt, ->] (axis cs:1,0) arc [radius=1, start angle=0,end angle=-315];
\end{axis}
\end{tikzpicture}
\end{document}
答案2
\documentclass[11pt]{article}
\usepackage{tikz}
\usetikzlibrary{patterns,angles}
\begin{document}

\tikz \draw (2,0) coordinate (A) -- (0,0) coordinate (B)
-- (-1,-1) coordinate (C)
pic [draw,->,red,pattern=north west lines] {angle = A--B--C}
pic [draw,<-,blue,pattern=north east lines,thick,angle radius=1cm] {angle = C--B--A};

\end{document}

采用给定的代码:
\documentclass[11pt]{article}
\usepackage{pgfplots}
\pgfplotsset{compat=1.7}
\usepgfplotslibrary{fillbetween}
\usetikzlibrary{patterns,angles}
\begin{document}

\pgfdeclarepatternformonly[\LineSpace]{my north west lines}{\pgfqpoint{-1pt}{-1pt}}{\pgfqpoint{\LineSpace}{\LineSpace}}{\pgfqpoint{\LineSpace}{\LineSpace}}%
{
    \pgfsetlinewidth{0.4pt}
    \pgfpathmoveto{\pgfqpoint{0pt}{\LineSpace}}
    \pgfpathlineto{\pgfqpoint{\LineSpace + 0.1pt}{-0.1pt}}
    \pgfusepath{stroke}
}

\newdimen\LineSpace
\tikzset{
    line space/.code={\LineSpace=#1},
    line space=3pt
}

\begin{tikzpicture}

\begin{axis}[hide axis, xmin=-10, ymin=-10, xmax=10,ymax=10,
disabledatascaling]

\addplot[domain=0:10,samples=300]
{0};
\addplot[domain=0:6,samples=300]
{x};

\addplot[red,domain=0:7,samples=300]
{x/2};

\addplot[domain=0:9,samples=300,name path=A]
{0}coordinate (A);                  %% define a coordinate
\addplot[domain=0:4,samples=300,name path=B]
{x}coordinate (B);                  %% define another coordinate

\addplot[line space=5pt, pattern= my north west lines] fill between[of=A and B];
\draw [red, line width=2pt, ->] (axis cs:2,0) arc [radius=2, start angle=0,end angle=45];

\coordinate (O) at (axis cs:0,0);                    %% define another coordinate
\draw pic [draw,<-,blue,pattern=north east lines,thick,angle radius=1cm] {angle = B--O--A}; %% draw the fill

\end{axis}
\end{tikzpicture}
\end{document}
