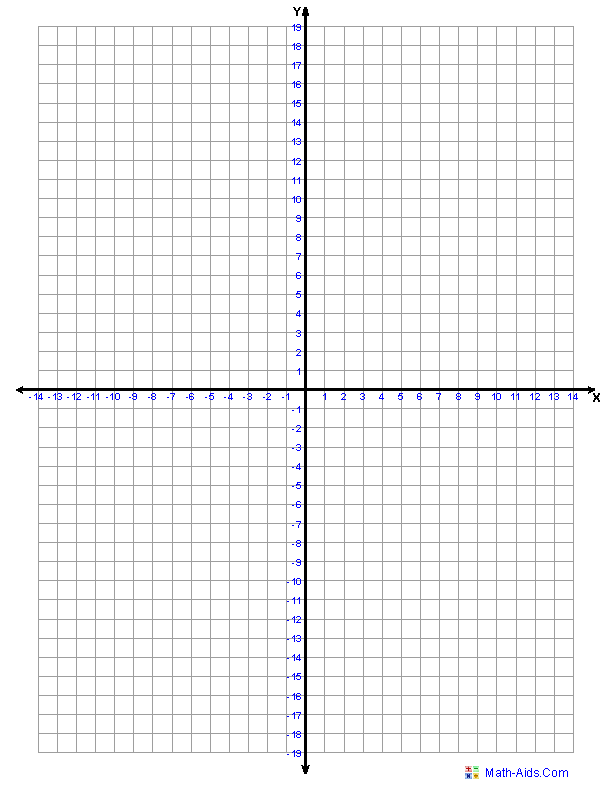
我需要制作一个笛卡尔平面来绘制连接点 (-3,1) 和 (6,-2) 的直线。这是一个非常简单的笛卡尔平面绘图。当我查看 tikz 手册时,笛卡尔平面的图形用于更高级的绘图,而我需要的非常简单。
像这样:

答案1
解决方案pstricks。该pst-eucl包是为平面几何设计的。它的\pstlineAB命令用两个点定义一条线;该线可以在两个点之间选定的距离处停止,这允许由两个点定义的线与图形宽度相同(太长的线会被环境裁剪pspicture*)。我不得不修补标签制作命令,以便像图中一样使用彩色无数学。
\documentclass[a4paper, 11pt, x11names, svgnames]{article}
\usepackage[margin=1.5cm]{geometry}
\usepackage{pstricks-add, pst-eucl}
\usepackage{auto-pst-pdf}
\usepackage{xcolor}

\usepackage{sansmath}
\usepackage{etoolbox}
\pretocmd{\pshlabel}{\color[rgb]{0.27 0.32 0.71}\sansmath}{}{}
\pretocmd{\psvlabel}{\color[rgb]{0.27 0.32 0.71}\sansmath}{}{}{}%

\begin{document}%

\psset{unit=5mm, ticks=none, xlabelsep=1pt, ylabelsep=1pt}

\begin{pspicture*}(-15,-20)(15,20)
\psaxes[labelFontSize = \scriptstyle\sansmath]{<->}(0,0)(-15,-20)(15,20)[\textsf{X}\rule{0pt}{2.25ex},-120][\textsf{Y}, -150]
\psset{linecolor=DodgerBlue4, tickcolor=white, subtickcolor=DodgerBlue4, gridlabelcolor=Dodgerblue4, ,linewidth=1.2pt}%
\pstGeonode[PosAngle=90](-3,1){A}(6,-2){B}
\pstLineAB[linecolor=SlateGray3, nodesep=-20]{A}{B}
\ncline[offset=-1.2pt, linecolor=LightSalmon1]{A}{B}
\psset{gridwidth=0.3pt, subgriddiv=1,gridlabels=0pt}
\psgrid(-14,-19)(14,19)
\end{pspicture*}

\end{document}

答案2
您可以查看pgfplots
\documentclass{standalone}
\usepackage{pgfplots}
\begin{document}
\begin{tikzpicture}
\begin{axis}[axis lines=middle,axis equal,grid=both]
\addplot coordinates{(-3,1) (6,-2)};
\end{axis}
\end{tikzpicture}
\end{document}

答案3
只是为了和 PSTricks 一起玩。
\documentclass[pstricks,12pt,dvipsnames]{standalone}
\usepackage{amsmath}
\usepackage{pstricks-add}
\usepackage{pst-plot}

\usepackage[nomessages]{fp}

\FPeval\XMin{0-pi}
\FPeval\XMax{2*pi}
\FPeval\YMin{0-4}
\FPeval\YMax{4}

\FPeval\XOL{0-1/2} % of DeltaX
\FPeval\XOR{1/2} % of DeltaX
\FPeval\YOB{0-1/4} % of DeltaY
\FPeval\YOT{1/4} % of DeltaY

\FPset\xTrigLabelBase{4}
\FPeval\yTrigLabelBase{pi}
\FPset\Dx{1}
\FPset\Dy{1}

\FPeval\dx{pi/xTrigLabelBase*Dx}
\FPeval\dy{pi/yTrigLabelBase*Dy}

\FPeval\AxisL{XMin+dx*XOL}
\FPeval\AxisR{XMax+dx*XOR}
\FPeval\AxisB{YMin+dy*YOB}
\FPeval\AxisT{YMax+dy*YOT}


\newlength\Width\Width=12cm
\newlength\Height\Height=8cm

\newlength\llx\llx=-5pt
\newlength\urx\urx=15pt
\newlength\lly\lly=-5pt
\newlength\ury\ury=15pt


\psset
{
    llx=\llx,
    lly=\lly,
    urx=\urx,
    ury=\ury,
    xtrigLabels=true,
    %ytrigLabels=true,
    xtrigLabelBase=\xTrigLabelBase,
    %ytrigLabelBase=\yTrigLabelBase,
    labelFontSize=\scriptstyle,
    xAxisLabel=$x$,
    yAxisLabel=$y$,
    algebraic,
    plotpoints=10000,
}

\newpsstyle{mygrid}
{
        dx=\dx,
        dy=\dy,
        %Dx=\Dx,
        %Dy=\Dy,
        labels=none,
        subticks=5,
        tickwidth=.4pt,
        subtickwidth=.2pt,
        tickcolor=Red!30,
        subtickcolor=ForestGreen!30,
        xticksize=\YMin\space \YMax,
        yticksize=\XMin\space \XMax,
        subticksize=1,
}

\def\f{2^(x/4)*sin(1.7^x)}

\begin{document}

\begin{psgraph}
    [
        dx=\dx,
        dy=\dy,
        Dx=\Dx,
        Dy=\Dy,
        linecolor=gray,
        tickcolor=gray,
        ticksize=-3pt 3pt,
        axespos=top,
    ]{<->}(0,0)(\AxisL,\AxisB)(\AxisR,\AxisT){\dimexpr\Width-\urx+\llx}{!}%{\dimexpr\Height-\ury+\lly}
    \psaxes[style=mygrid](0,0)(\XMin,\YMin)(\XMax,\YMax)
    \psplot[linecolor=Maroon,linewidth=2pt]{\XMin}{\XMax}{\f}
\end{psgraph}
\end{document}


