

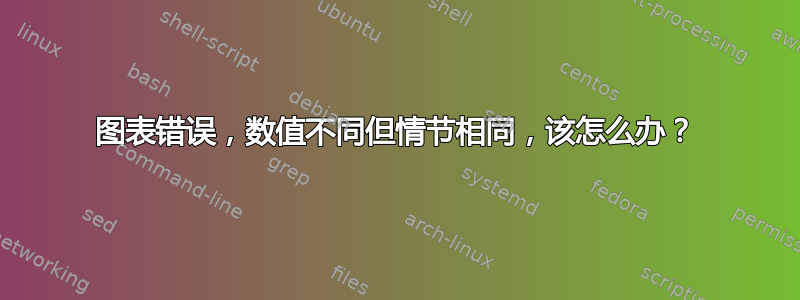
尝试绘制文本文件中的一些数据,值不同,但最终结果中的图重叠。代码如下:
\documentclass{article}
\usepackage{geometry}
\usepackage{amsmath}
\usepackage{mathtools}
\usepackage[T1]{fontenc}
\usepackage{tikz}
\usepackage{pgfplots}


\begin{document}
\begin{figure}[h]
\centering
\begin{tikzpicture}
\begin{semilogyaxis}[
scale=2.00,
xlabel={\large$\frac{E_s}{N_o}$ \normalsize},
ylabel={$P_b(e)$},
grid=major,
legend pos=outer north east,
legend cell align = left]

\addplot[color=black,mark=circle,y=ber1,x=eb] table {SISO_4.txt};
\addplot[color=black,thick,y=ber2,x=eb] table {SISO_4.txt};
\addplot[color=black,mark=diamond,y=ber3,x=eb] table {SISO_4.txt};

\legend{BER[1],BER[2],BER[3]}

\end{semilogyaxis}
\end{tikzpicture}
\caption{Probability of Bit Error vs. Signal to Noise Ratio \large$\frac{E_s}{N_o}$} % title
\end{figure}

\end{document}
文件SISO.txt如下:
eb  ber0        ber1        ber2        ber3
0   7.90E-02    7.84E-02    1.17E-03    2.48E-03
1   5.62E-02    5.62E-02    2.64E-04    5.41E-04
2   3.76E-02    3.73E-02    4.40E-05    1.02E-04
3   2.29E-02    2.28E-02    2.00E-06    5.50E-06
4   1.26E-02    1.25E-02    0.00E+00    1.00E-06
5   6.03E-03    5.92E-03    0.00E+00    0.00E+00
6   2.37E-03    2.40E-03    0.00E+00    0.00E+00
7   7.37E-04    7.47E-04    0.00E+00    0.00E+00
8   2.00E-04    1.93E-04    0.00E+00    0.00E+00
9   4.00E-05    3.10E-05    0.00E+00    0.00E+00
10  1.00E-06    7.00E-06    0.00E+00    0.00E+00
但输出图是这样的:

有人能帮忙吗?谢谢。
答案1
您需要将列规范放入table选项中。见下文。请注意,我更改了几件事:
- 这
mathtools包加载amsmath包,因此不需要同时加载两者 - 这
pgfplots包加载tikz包,因此不需要同时加载两者 circle不是有效的标记形状。实心圆的正确标记为*,空心圆的正确标记为o。- 您应该有设置
compat的选项pgfplots。我添加了版本1.11,这是截至本回答的最新版本 - 注意,不建议仅使用
[h]来指定 的位置figure。(我需要为此找到参考)
\documentclass{article}
\usepackage{geometry}
\usepackage{mathtools}
\usepackage[T1]{fontenc}
\usepackage{pgfplots}
\pgfplotsset{compat=1.11}

\begin{document}
\begin{figure}
\centering
\begin{tikzpicture}
\begin{semilogyaxis}[
scale=2.00,
xlabel={\large$\frac{E_s}{N_o}$ \normalsize},
ylabel={$P_b(e)$},
grid=major,
legend pos=outer north east,
legend cell align = left]

\addplot[color=black,mark=o] table[y=ber1,x=eb] {SISO_4.txt};
\addplot[color=black,thick] table[y=ber2,x=eb] {SISO_4.txt};
\addplot[color=black,mark=diamond] table[y=ber3,x=eb] {SISO_4.txt};

\legend{BER[1],BER[2],BER[3]}

\end{semilogyaxis}
\end{tikzpicture}
\caption{Probability of Bit Error vs. Signal to Noise Ratio \large$\frac{E_s}{N_o}$} % title
\end{figure}

\end{document}