


答案1
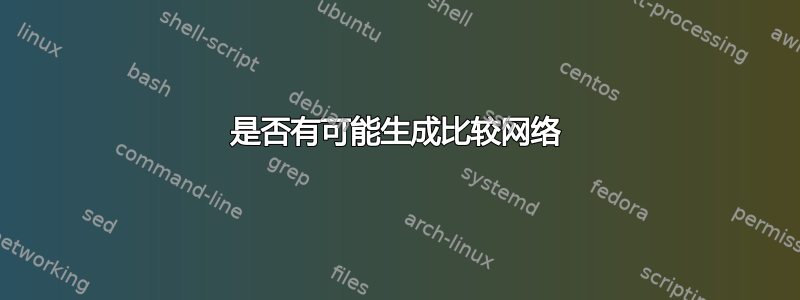
另一种方法是使用matrix of nodes一种tikz称为绘制黑色圆圈的样式定义phase。然后将所有节点放入具有唯一内部标签的矩阵形式中,通过绘制命令将它们用线连接起来。
\tikzset{
phase/.style = {draw,fill,shape=circle,minimum size=3pt,inner sep=0pt},
}

代码
\documentclass[]{standalone}
\usepackage{tikz}
\usetikzlibrary{positioning,calc}

\begin{document}
\begin{tikzpicture}[thick]

% `phase' is used for controlled phase gates (dots).

\tikzset{
phase/.style = {draw,fill,shape=circle,minimum size=3pt,inner sep=0pt},
}
\matrix[row sep=0.4cm, column sep=0.5cm] (circuit) { % 7 columns
    % First row.
\node [] (start1) {};
& \node [phase] (c12) {};
& \node [phase] (c13) {};
& \node [] (c14) {};
& \node [phase] (c15) {};
& \node [] (c16) {};
& \node [] (c17) {};
&\coordinate (end1); \\
    % Second row.
\node [] (start2) {};
& \node [phase] (c22) {};
& \node [] (c23) {};
\node [right=1pt of c23,phase] (c23b) {};
& \node [phase] (c24) {};
& \node [] (c25) {};
\node [right= 1pt of c25,phase] (c25b) {};
& \node [] (c26) {};
& \node [phase] (c27) {};
&\coordinate (end2); \\
%    % Third row.
\node [] (start3) {};
& \node [phase] (c32) {};
& \node [phase] (c33) {};
& \node [phase] (c34) {};
& \node [] (c35) {};
\node [right=7pt of c35, phase] (c35b) {};
& \node [phase] (c36) {};
& \node [phase] (c37) {};
&\coordinate (end3); \\
%     Fourth row.
\node [] (start4) {};
& \node [phase] (c42) {};
& \node [] (c43) {};
\node [right=1pt of c43, phase] (c43b) {};
& \node [] (c44) {};
& \node [] (c45) {};
\node [right=13pt of c45, phase] (c45b) {};
& \node [] (c46) {};
\node [right=1pt of c46, phase] (c46b) {};
& \node [phase] (c47) {};
&\coordinate (end4); \\
    % 5th row.
\node [] (start5) {};
& \node [phase] (c52) {};
& \node [phase] (c53) {};
& \node [] (c54) {};
& \node [phase] (c55) {};
& \node [phase] (c56) {};
& \node [phase] (c57) {};
&\coordinate (end5); \\
    % 6th row.
\node [] (start6) {};
& \node [phase] (c62) {};
& \node [] (c63) {};
\node [right=1pt of c63,phase] (c63b) {};
& \node [phase] (c64) {};
& \node [] (c65) {};
\node [right= 1pt of c65,phase] (c65b) {};
& \node [] (c66) {};
\node [right=1pt of c66, phase] (c66b) {};
& \node [phase] (c67) {};
&\coordinate (end6); \\
%  % 7th row.
\node [] (start7) {};
& \node [phase] (c72) {};
& \node [phase] (c73) {};
& \node [phase] (c74) {};
& \node [] (c75) {};
\node [right=7pt of c75,phase] (c75b) {};
& \node [] (c76) {};
& \node [phase] (c77) {};
&\coordinate (end7); \\
%     8th row.
\node [] (start8) {};
& \node [phase] (c82) {};
& \node [] (c83) {};
\node [right=1pt of c83, phase] (c83b) {};
& \node [] (c84) {};
& \node [] (c85) {};
\node [right=13pt of c85, phase] (c85b) {};
& \node [] (c86) {};
& \node [] (c87) {};
&\coordinate (end8); \\
};

% Draw lines.

\draw[thick] (start1) -- (end1)
(start2) -- (end2) (start3) -- (end3)  (start4) -- (end4)
(start5) -- (end5)  (start6) -- (end6)  (start7) -- (end7)
(start8) -- (end8) ;
\draw(c12) -- (c22)      (c32) -- (c42)  (c52) -- (c62)  (c72) -- (c82);
\draw(c13)  -- (c33)     (c24) -- (c34);
\draw(c23b)-- (c43b)  (c63b)--(c83b);
\draw(c27) -- (c37)  (c47) -- (c57)  (c53) -- (c73);
\draw(c64) -- (c74)  (c67) -- (c77);
\draw(c15) -- (c55)  (c25b)--(c65b)  (c35b)--(c75b) (c45b)--(c85b);
\draw (c36)-- (c56)  (c46b)--(c66b);

\end{tikzpicture}
\end{document}
答案2
以下软件包/软件可能比您所需的功能更多,因为它可以绘制通用量子电路。不过,它应该可以满足您的需要。
QCircuit(我知道这个页面很丑)
一个例子是(这需要下载Qcircuit.tex从链接中将其放在您的 tex 文件夹中)
\documentclass{amsart}
\usepackage[matrix,frame,arrow]{xypic}
\input{Qcircuit}
\vfuzz2pt

\begin{document}
\[
\Qcircuit @C=1.0em @R=.7em {
& \ctrl{3} & \qw & \qw & \qw & \ctrl{5} & \qw & \qw\\
& \qw & \ctrl{2} & \ctrl{3} & \qw & \qw & \qw & \qw\\
& \qw & \qw & \qw & \ctrl{2} & \qw & \ctrl{3} & \qw\\
& \control \qw & \control \qw & \qw & \qw & \qw& \qw& \qw\\
& \qw & \qw & \control \qw & \control \qw & \qw & \qw & \qw \\
& \qw & \qw & \qw & \qw & \control \qw & \control \qw & \qw
}
\]
\end{document}
给予 。
。
我提到的额外软件是这个(虽然可能没有必要)
答案3
该宏\dx[]提供长度为 的水平空间\dxO。可选参数指定 的倍数\dxO。该宏\link{y1}{y2}指定垂直条,其中y1和y2是整数,乘以\dz是网格间距。
\documentclass{article}
\usepackage[usestackEOL]{stackengine}
\def\gline{\rule{2in}{1pt}}
\newlength\dz
\dz=4ex\relax
\newlength\dxO
\dxO=1.33ex\relax
\setstackgap{L}{\dz}
\def\grid{\Longstack{\gline\\\gline\\\gline\\\gline\\\gline\\\gline\\\gline\\\gline}}
\newcommand\link[2]{\makebox[0pt]{\drule[#1\dz]{1pt}{#2\dz}}\ignorespaces}
\newcommand\drule[3][0pt]{%
  \setstackgap{S}{0pt}%
  \raisebox{#1}{\Shortstack{\sbullet\\\rule{#2}{\dimexpr#3-#1\relax}\\\sbullet}}}
\def\sbullet{\smash{\raisebox{-2pt}{$\bullet$}}}
\newcommand\dx[1][1]{\hspace{#1\dxO}}
\begin{document}![enter image description here][2]
\noindent\rlap{\grid}
\dx[2]\link{0}{1}\link{2}{3}\link{4}{5}\link{6}{7}
\dx[3]\link{1}{3}\link{5}{7}
\dx\link{0}{2}\link{4}{6}
\dx[3]\link{1}{2}\link{5}{6}
\dx[3]\link{3}{7}
\dx\link{2}{6}
\dx\link{1}{5}
\dx\link{0}{4}
\dx[3]\link{3}{5}
\dx\link{2}{4}
\dx[3]\link{1}{2}\link{3}{4}\link{5}{6}
\end{document}
