

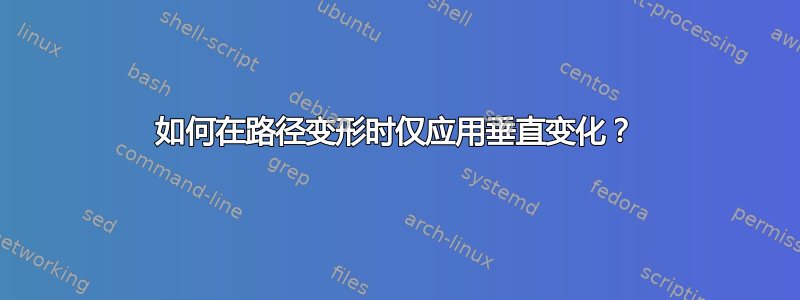
我想重新创建下面显示的图像。

我正在努力解决“非接触模式”部分的问题。这是我目前取得的成果:
\documentclass[a4paper]{scrartcl}
\usepackage[utf8]{inputenc}
\usepackage[ngerman]{babel}
\usepackage{pgfplots,pgfplotstable}\pgfplotsset{compat=1.5.1, every axis/.append style={font=\small}}

\begin{document}
    \begin{tikzpicture}[auto, thick]

        \node[text centered, text width=4cm, fill=white] at (0,2) {Contact-Mode};
        \draw[draw=none, fill=gray!40!white, xshift=-0.5cm] plot [smooth, tension=0.7] coordinates {(-2,-0.5) (-2,0.2) (-2,0.2) (-2,0.2) (-1.5,0) (-1,0.1) (-0.6,0.05) (-0.3,0.3) (0,0.1) (0.7,-0.1) (0.9,0) (1.1,-0.1) (1.5,0.2) (2,0) (2.7,0.05) (3,-0.05) (3,-0.05) (3,-0.05) (3,-0.5)};
        \draw[very thick, red, xshift=-0.5cm, yshift=0.5] plot [smooth, tension=0.7] coordinates {(-2,0.2) (-1.5,0) (-1,0.1) (-0.6,0.05) (-0.3,0.3) (0,0.1) (0.7,-0.1) (0.9,0) (1.1,-0.1) (1.5,0.2) (2,0) (2.7,0.05) (3,-0.05)};

        \begin{scope}[xshift=0.65cm, yshift=0.4cm, rotate=20]
        \coordinate (a) at (0,0);
        \coordinate (b) at (0.3,0);
        \coordinate (c) at (0.15,-0.26);
        \coordinate (d) at (2,0);
        \draw[fill=black] (a) -- (b) -- (c) -- cycle;
        \draw (b) -- (d);
        \end{scope}

        \begin{scope}[xshift=7cm]
        \node[text centered, text width=4cm, fill=white] at (0,2) {Non-Contact-Mode};
        \draw[draw=none, fill=gray!40!white, xshift=-0.5cm] plot [smooth, tension=0.7] coordinates {(-2,-0.5) (-2,0.2) (-2,0.2) (-2,0.2) (-1.5,0) (-1,0.1) (-0.6,0.05) (-0.3,0.3) (0,0.1) (0.7,-0.1) (0.9,0) (1.1,-0.1) (1.5,0.2) (2,0) (2.7,0.05) (3,-0.05) (3,-0.05) (3,-0.05) (3,-0.5)};
        \draw[decorate, decoration={snake, amplitude=2pt, segment length=3pt}, thick, red, xshift=-0.5cm, yshift=5] plot [smooth, tension=0.7] coordinates {(-2,0.2) (-1.5,0) (-1,0.1) (-0.6,0.05) (-0.3,0.3) (0,0.1) (0.7,-0.1) (0.9,0) (1.1,-0.1) (1.5,0.2) (2,0) (2.7,0.05) (3,-0.05)};

        \begin{scope}[xshift=0.62cm, yshift={0.48cm+5}, rotate=18]
        \coordinate (a) at (0,0);
        \coordinate (b) at (0.3,0);
        \coordinate (c) at (0.15,-0.26);
        \coordinate (d) at (2,0);
        \draw[fill=gray, gray] (a) -- (b) -- (c) -- cycle;
        \draw[gray] (b) -- (d);
        \end{scope}

        \begin{scope}[xshift=0.65cm, yshift={0.4cm+5}, rotate=20]
        \coordinate (a) at (0,0);
        \coordinate (b) at (0.3,0);
        \coordinate (c) at (0.15,-0.26);
        \coordinate (d) at (2,0);
        \draw[fill=black] (a) -- (b) -- (c) -- cycle;
        \draw (b) -- (d);
        \end{scope}
        \end{scope}

\end{tikzpicture}
\end{document}

如您所见,唯一需要改变的是此行中的路径变形:
\draw[decorate, decoration={snake, amplitude=2pt, segment length=3pt}, thick, red, xshift=-0.5cm, yshift=5] plot [smooth, tension=0.7] coordinates {(-2,0.2) (-1.5,0) (-1,0.1) (-0.6,0.05) (-0.3,0.3) (0,0.1) (0.7,-0.1) (0.9,0) (1.1,-0.1) (1.5,0.2) (2,0) (2.7,0.05) (3,-0.05)};
我基本上想要一个只影响路径 x 坐标的蛇形路径变形。换句话说:我想要一个中心沿着定义的路径移动的正弦曲线。
答案1
看起来像 Ti钾Z 自动使用弗雷内-塞雷特坐标系绘制装饰。要撤消此操作,我们需要重置当前变换的旋转/缩放/倾斜部分,但保留移动部分 --- 这就是所\pgftransformresetnontranslations声称要做的。
zigzag因此修改from的定义pgflibrarydecorations.pathmorphing.code.tex以获得
\pgfdeclaredecoration{hopping}{up from center}{
  \state{up from center}[width=+.5\pgfdecorationsegmentlength, next state=big down]
  {
    \pgftransformresetnontranslations
    \pgfpathlineto{\pgfqpoint{.25\pgfdecorationsegmentlength}{\pgfdecorationsegmentamplitude}}
  }
  \state{big down}[switch if less than=+.5\pgfdecorationsegmentlength to center finish,
                   width=+.5\pgfdecorationsegmentlength,
                   next state=big up]
  {
    \pgftransformresetnontranslations
    \pgfpathlineto{\pgfqpoint{.25\pgfdecorationsegmentlength}{-\pgfdecorationsegmentamplitude}}
  }
  \state{big up}[switch if less than=+.5\pgfdecorationsegmentlength to center finish,
                 width=+.5\pgfdecorationsegmentlength,
                 next state=big down]
  {
    \pgftransformresetnontranslations
    \pgfpathlineto{\pgfqpoint{.25\pgfdecorationsegmentlength}{\pgfdecorationsegmentamplitude}}
  }
  \state{center finish}[width=0pt, next state=final]{
    \pgfpathlineto{\pgfpointorigin}
  }
  \state{final}
  {
    \pgftransformresetnontranslations
    \pgfpathlineto{\pgfpointdecoratedpathlast}
  }
}
然后应用它们

以下是完整的示例
\documentclass[a4paper]{scrartcl}
\usepackage[utf8]{inputenc}
\usepackage[ngerman]{babel}
\usepackage{pgfplots,pgfplotstable}\pgfplotsset{compat=1.5.1, every axis/.append style={font=\small}}

\begin{document}

\pgfdeclaredecoration{hopping}{up from center}{
  \state{up from center}[width=+.5\pgfdecorationsegmentlength, next state=big down]
  {
    \pgftransformresetnontranslations
    \pgfpathlineto{\pgfqpoint{.25\pgfdecorationsegmentlength}{\pgfdecorationsegmentamplitude}}
  }
  \state{big down}[switch if less than=+.5\pgfdecorationsegmentlength to center finish,
                   width=+.5\pgfdecorationsegmentlength,
                   next state=big up]
  {
    \pgftransformresetnontranslations
    \pgfpathlineto{\pgfqpoint{.25\pgfdecorationsegmentlength}{-\pgfdecorationsegmentamplitude}}
  }
  \state{big up}[switch if less than=+.5\pgfdecorationsegmentlength to center finish,
                 width=+.5\pgfdecorationsegmentlength,
                 next state=big down]
  {
    \pgftransformresetnontranslations
    \pgfpathlineto{\pgfqpoint{.25\pgfdecorationsegmentlength}{\pgfdecorationsegmentamplitude}}
  }
  \state{center finish}[width=0pt, next state=final]{
    \pgfpathlineto{\pgfpointorigin}
  }
  \state{final}
  {
    \pgftransformresetnontranslations
    \pgfpathlineto{\pgfpointdecoratedpathlast}
  }
}


    \begin{tikzpicture}[auto, thick]

        \node[text centered, text width=4cm, fill=white] at (0,2) {Contact-Mode};
        \draw[draw=none, fill=gray!40!white, xshift=-0.5cm] plot [smooth, tension=0.7] coordinates {(-2,-0.5) (-2,0.2) (-2,0.2) (-2,0.2) (-1.5,0) (-1,0.1) (-0.6,0.05) (-0.3,0.3) (0,0.1) (0.7,-0.1) (0.9,0) (1.1,-0.1) (1.5,0.2) (2,0) (2.7,0.05) (3,-0.05) (3,-0.05) (3,-0.05) (3,-0.5)};
        \draw[very thick, red, xshift=-0.5cm, yshift=0.5] plot [smooth, tension=0.7] coordinates {(-2,0.2) (-1.5,0) (-1,0.1) (-0.6,0.05) (-0.3,0.3) (0,0.1) (0.7,-0.1) (0.9,0) (1.1,-0.1) (1.5,0.2) (2,0) (2.7,0.05) (3,-0.05)};

        \begin{scope}[xshift=0.65cm, yshift=0.4cm, rotate=20]
        \coordinate (a) at (0,0);
        \coordinate (b) at (0.3,0);
        \coordinate (c) at (0.15,-0.26);
        \coordinate (d) at (2,0);
        \draw[fill=black] (a) -- (b) -- (c) -- cycle;
        \draw (b) -- (d);
        \end{scope}

        \begin{scope}[xshift=7cm]
        \node[text centered, text width=4cm, fill=white] at (0,2) {Non-Contact-Mode};
        \draw[draw=none, fill=gray!40!white, xshift=-0.5cm] plot [smooth, tension=0.7] coordinates {(-2,-0.5) (-2,0.2) (-2,0.2) (-2,0.2) (-1.5,0) (-1,0.1) (-0.6,0.05) (-0.3,0.3) (0,0.1) (0.7,-0.1) (0.9,0) (1.1,-0.1) (1.5,0.2) (2,0) (2.7,0.05) (3,-0.05) (3,-0.05) (3,-0.05) (3,-0.5)};
        \draw[decorate, decoration={hopping, amplitude=3pt, segment length=3pt}, thick, red, xshift=-0.5cm, yshift=5] plot [smooth, tension=0.7] coordinates {(-2,0.2) (-1.5,0) (-1,0.1) (-0.6,0.05) (-0.3,0.3) (0,0.1) (0.7,-0.1) (0.9,0) (1.1,-0.1) (1.5,0.2) (2,0) (2.7,0.05) (3,-0.05)};

        \begin{scope}[xshift=0.62cm, yshift={0.48cm+5}, rotate=18]
        \coordinate (a) at (0,0);
        \coordinate (b) at (0.3,0);
        \coordinate (c) at (0.15,-0.26);
        \coordinate (d) at (2,0);
        \draw[fill=gray, gray] (a) -- (b) -- (c) -- cycle;
        \draw[gray] (b) -- (d);
        \end{scope}

        \begin{scope}[xshift=0.65cm, yshift={0.4cm+5}, rotate=20]
        \coordinate (a) at (0,0);
        \coordinate (b) at (0.3,0);
        \coordinate (c) at (0.15,-0.26);
        \coordinate (d) at (2,0);
        \draw[fill=black] (a) -- (b) -- (c) -- cycle;
        \draw (b) -- (d);
        \end{scope}
        \end{scope}

\end{tikzpicture}
\end{document}