

我正在尝试制作一个图表,但收到无法读取文件的错误。我确保 dat 文件位于文件目录中,.tex并且拼写正确。错误还建议我在每行末尾使用row sep=crcr并放置\\
,但我不知道该怎么做。这只是数据的一小部分,以便更易于排除故障。
    \documentclass{article}
    \usepackage[margin=0.5in]{geometry}
    \usepackage[utf8]{inputenc}
    \usepackage{textcomp}
    \usepackage{pgfplots}
    \usepackage{filecontents}


    \begin{filecontents}{ST043-2.dat}
    nm 0 2.3 3.5 5.2 7.8 11.7 17.6 26.3 39.5 59.3 88.9 133.3 200 300
    384 0.133 0.154 0.156 0.159 0.154 0.152 0.149 0.142 0.14 0.139 0.146   0.173 0.192 0.226
    385 0.132 0.155 0.157 0.159 0.156 0.152 0.149 0.142 0.14 0.139 0.145 0.172 0.192 0.224
    386 0.135 0.156 0.158 0.16 0.158 0.153 0.149 0.142 0.139 0.14 0.144 0.17 0.191 0.223
    387 0.137 0.158 0.158 0.162 0.159 0.154 0.15 0.141 0.138 0.14 0.144 0.169 0.189 0.222
    388 0.137 0.159 0.159 0.162 0.161 0.155 0.15 0.14 0.139 0.14 0.144 0.17 0.188 0.223
    389 0.137 0.159 0.16 0.163 0.161 0.155 0.149 0.139 0.138 0.138 0.143 0.166 0.185 0.221
    390 0.141 0.162 0.162 0.165 0.162 0.155 0.15 0.141 0.138 0.137 0.143 0.164 0.185 0.219
    391 0.144 0.166 0.166 0.168 0.165 0.158 0.152 0.143 0.139 0.138 0.142 0.165 0.184 0.217
    392 0.15 0.17 0.171 0.171 0.168 0.161 0.154 0.144 0.14 0.14 0.142 0.166 0.185 0.216
    393 0.153 0.173 0.175 0.173 0.171 0.162 0.156 0.144 0.141 0.14 0.142 0.165 0.183 0.214
    394 0.157 0.177 0.179 0.178 0.175 0.166 0.159 0.146 0.142 0.141 0.143 0.165 0.182 0.213
    395 0.162 0.181 0.183 0.182 0.178 0.169 0.16 0.147 0.143 0.14 0.143 0.164 0.179 0.211
    396 0.169 0.187 0.188 0.187 0.182 0.173 0.162 0.148 0.144 0.141 0.142 0.164 0.179 0.211
    397 0.171 0.194 0.195 0.194 0.188 0.179 0.165 0.15 0.146 0.142 0.142 0.164 0.179 0.211
    398 0.182 0.201 0.202 0.2 0.195 0.184 0.168 0.152 0.148 0.143 0.143 0.163 0.179 0.21
    399 0.189 0.209 0.21 0.208 0.202 0.19 0.174 0.156 0.151 0.145 0.144 0.163 0.178 0.209
    400 0.199 0.219 0.22 0.218 0.21 0.198 0.181 0.16 0.154 0.149 0.147 0.163 0.178 0.209
    401 0.209 0.228 0.229 0.227 0.219 0.206 0.186 0.163 0.157 0.152 0.148 0.163 0.176 0.209
    \end{filecontents}

    \begin{document}
    \pgfplotstableread{ST043-2.dat}{\ST043-2)}
    \begin{tikzpicture}[scale=1.2]
    \begin{axis}[
    Title={UV/VIS spectra of ST043-2},
    xlabel={nm},
    ylabel={Abs},
    xmin=385, xmax=550,
    xtick=50,
    ymajorgrids=true,
    grid style=dashed,
    ]
    \addplot [black,very thick,color=red] table [x={nm}, y={0}] {\ST043-2};
    \addplot [dashed,red,very thick,color=emerald] table [x={nm}, y={2.3}] {\ST043-2};
    \addplot [dashed,blue,very thick,color=apricot] table [x={nm}, y={3.5}] {\ST043-2};
    \addplot [dashed,red,very thick,color=emerald] table [x={nm}, y={5.2}] {\ST043-2};
    \addplot [dashed,red,very thick,color=olivegreen] table [x={nm}, y={7.8}] {\ST043-2};

     \end{axis}
     \end{tikzpicture}
     \end{document}
答案1
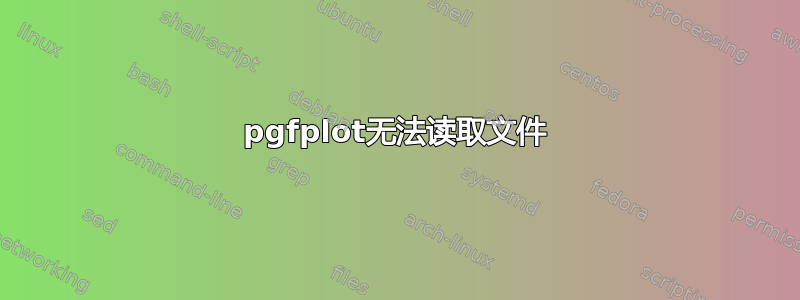
您无法读取文件的原因是命令\ST043-2解析不正确。我猜是连字符-破坏了命令。如果我将所有实例替换\ST043-2为\stear下面的代码,它可以编译成功。(我还删除了颜色名称,因为使用颜色名称无法编译。)
\documentclass{article}
\usepackage[margin=0.5in]{geometry}
\usepackage[utf8]{inputenc}
\usepackage{textcomp}
\usepackage{pgfplots}
\usepackage{filecontents}
\usepackage{xcolor}


\begin{filecontents}{ST043-2.dat}
nm 0 2.3 3.5 5.2 7.8 11.7 17.6 26.3 39.5 59.3 88.9 133.3 200 300
384 0.133 0.154 0.156 0.159 0.154 0.152 0.149 0.142 0.14 0.139 0.146   0.173 0.192 0.226
385 0.132 0.155 0.157 0.159 0.156 0.152 0.149 0.142 0.14 0.139 0.145 0.172 0.192 0.224
386 0.135 0.156 0.158 0.16 0.158 0.153 0.149 0.142 0.139 0.14 0.144 0.17 0.191 0.223
387 0.137 0.158 0.158 0.162 0.159 0.154 0.15 0.141 0.138 0.14 0.144 0.169 0.189 0.222
388 0.137 0.159 0.159 0.162 0.161 0.155 0.15 0.14 0.139 0.14 0.144 0.17 0.188 0.223
389 0.137 0.159 0.16 0.163 0.161 0.155 0.149 0.139 0.138 0.138 0.143 0.166 0.185 0.221
390 0.141 0.162 0.162 0.165 0.162 0.155 0.15 0.141 0.138 0.137 0.143 0.164 0.185 0.219
391 0.144 0.166 0.166 0.168 0.165 0.158 0.152 0.143 0.139 0.138 0.142 0.165 0.184 0.217
392 0.15 0.17 0.171 0.171 0.168 0.161 0.154 0.144 0.14 0.14 0.142 0.166 0.185 0.216
393 0.153 0.173 0.175 0.173 0.171 0.162 0.156 0.144 0.141 0.14 0.142 0.165 0.183 0.214
394 0.157 0.177 0.179 0.178 0.175 0.166 0.159 0.146 0.142 0.141 0.143 0.165 0.182 0.213
395 0.162 0.181 0.183 0.182 0.178 0.169 0.16 0.147 0.143 0.14 0.143 0.164 0.179 0.211
396 0.169 0.187 0.188 0.187 0.182 0.173 0.162 0.148 0.144 0.141 0.142 0.164 0.179 0.211
397 0.171 0.194 0.195 0.194 0.188 0.179 0.165 0.15 0.146 0.142 0.142 0.164 0.179 0.211
398 0.182 0.201 0.202 0.2 0.195 0.184 0.168 0.152 0.148 0.143 0.143 0.163 0.179 0.21
399 0.189 0.209 0.21 0.208 0.202 0.19 0.174 0.156 0.151 0.145 0.144 0.163 0.178 0.209
400 0.199 0.219 0.22 0.218 0.21 0.198 0.181 0.16 0.154 0.149 0.147 0.163 0.178 0.209
401 0.209 0.228 0.229 0.227 0.219 0.206 0.186 0.163 0.157 0.152 0.148 0.163 0.176 0.209
\end{filecontents}

\begin{document}
\pgfplotstableread{ST043-2.dat}{\stear}
\begin{tikzpicture}[scale=1.2]
\begin{axis}[
title={UV/VIS spectra of ST043-2},
xlabel={nm},
ylabel={Abs},
xmin=385, xmax=550,
xtick=50,
ymajorgrids=true,
grid style=dashed,
]
\addplot [black,very thick] table [x={nm}, y={0}] {\stear};
\addplot [dashed,red,very thick] table [x={nm}, y={2.3}] {\stear};
\addplot [dashed,blue,very thick] table [x={nm}, y={3.5}] {\stear};
\addplot [dashed,red,very thick] table [x={nm}, y={5.2}] {\stear};
\addplot [dashed,red,very thick] table [x={nm}, y={7.8}] {\stear};

 \end{axis}
 \end{tikzpicture}
 \end{document}