

当我想在 xy 轴上绘制一个矩形时,我需要将所有数字乘以十。我做错了什么?
\documentclass[symmetric,justified,a4paper]{tufte-book} % use larger type; default would be 10pt

\usepackage[utf8]{inputenc} % set input encoding (not needed with XeLaTeX)
\usepackage{amsmath,units} %voor wiskundige formules
\usepackage[dutch]{babel}
\usepackage[decimalsymbol=comma,per-mode=fraction,exponent-product = \cdot]{siunitx}
\sisetup{load-configurations = abbreviations}
\usepackage{tikz}
\usepackage{pgfplots}
\usetikzlibrary{calc,patterns,decorations.pathmorphing,decorations.markings}

\begin{document}
\begin{center}
\begin{tikzpicture}[scale=1, transform shape]
\begin{axis}[%
title=$F(\Delta x)$-grafiek,
major grid style=gray,
axis lines=center,
xmin=0, xmax=10,
ymin=0, ymax=25,
xtick={0,1,...,10},
ytick={0,5,...,25},
width=\textwidth,
%height=8cm,
xlabel=$\Delta x(\si{\m})$,
ylabel=$F(\si{\N})$,
%ticks=both,
minor xtick={0,1,...,10},
minor ytick={0,1,...,25},
grid=both,
%enlarge x limits={upper},
%enlarge y limits={upper}
]
\addplot[red, very thick, domain=0:8]  {20} node[above]{$F$};
\filldraw[fill opacity=.3,fill=orange] (0,0) rectangle (80,200) ;
\end{axis}
\end{tikzpicture}
\end{center}
\end{document}
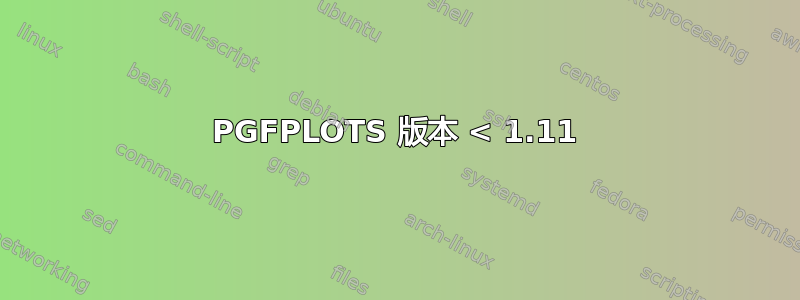
如您所见,矩形的尺寸应为(8,20),而不是(80,200)

答案1
PGFPLOTS 版本 < 1.11
看来您的 PGFPLOTS 版本低于 1.11。因此您应该使用:
rectangle (axis cs:8,20)
代替
rectangle (80,200)。
PGFPLOTS 版本 >= 1.11
如果您使用的是 PGFPLOTS 1.11 或更新版本,则axis cs:不需要。
来自 PGFPLOTS 手册版本 1.12.1(2.2.1 新可选功能):
PGFPLOTS 1.11 将 更改为
axis cs:默认坐标系。如果您写入\draw (1,2) -- (2,2);PGFPLOTS,将自动将其视为\draw (axis cs:1,2) -- (axis cs:2,2);。