

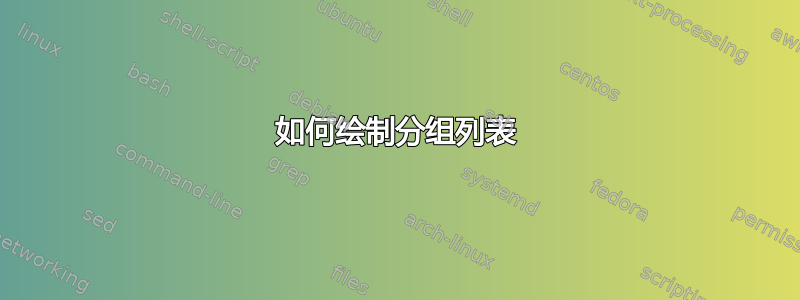
我需要在 LaTeX 中绘制一个分组列表,如下图所示:

在 MS Office 中,我可以通过 SmartArt - 分组列表来绘制它。在 LaTeX 中,我在 smartdiagram 和 TikZ 包中查找,但没有找到。你能帮助我吗?
答案1
您可以使用TikZ;positioning库用于相对于其他节点定位节点;fit和backgrounds库用于将带有圆角的周围框架放置在背景层中;为块定义了一些样式:

代码:
\documentclass[border=5pt]{standalone}
\usepackage{tikz}
\usetikzlibrary{positioning,backgrounds,fit}

\definecolor{bluei}{RGB}{83,116,191}
\definecolor{blueii}{RGB}{207,212,232}
\definecolor{greeni}{RGB}{135,200,81}
\definecolor{greenii}{RGB}{216,235,207}

\tikzset{
  myiblock/.style 2 args={
    draw=white,
    fill=#1,
    line width=1pt,
    rounded corners,
    minimum height=1cm,
    align=center,
    text=white,
    font=\sffamily,
    text width=#2
  },
  myoblock/.style={
    fill=#1,
    rounded corners,
    align=center,
    inner xsep=10pt
  }
}

\begin{document}

\begin{tikzpicture}[node distance=0.5cm and 1cm]
\node[myiblock={bluei}{2cm}]
  (info1)
  {Info about \\ one piece};
\node[myiblock={bluei}{2cm},below=of info1]
  (info2)
  {Other};
\node[above=3pt of info1,font=\sffamily]
  (title1)
  {Structure 1};
\begin{pgfonlayer}{background}
\node[myoblock=blueii,fit={(title1) (info2)}] {};
\end{pgfonlayer}
\begin{scope}[xshift=4cm,node distance=3pt and 1cm]
\node[myiblock={greeni}{2cm}]
  (infoob1)
  {Info object 1};
\node[myiblock={greeni}{2cm},below=of infoob1]
  (infoob2)
  {Info object 2};
\node[myiblock={greeni}{2cm},below=of infoob2]
  (infoob3)
  {Info object 3};
\node[above=3 pt of infoob1,font=\sffamily]
  (title2)
  {Structure 2};
\begin{pgfonlayer}{background}
\node[myoblock=greenii,fit={(title2) (infoob3)}] {};
\end{pgfonlayer}
\end{scope}
\end{tikzpicture}

\end{document}
答案2
Gonzalo 解决方案的替代方案可能是使用matrix节点。节点matrix是节点的容器,其尺寸根据内容进行调整。这意味着不需要fit和background库。
甚至有了matrix of nodes,声明每个列表节点就更加容易了。
\documentclass[border=5pt]{standalone}
\usepackage{tikz}
\usetikzlibrary{matrix, positioning}

\definecolor{bluei}{RGB}{83,116,191}
\definecolor{blueii}{RGB}{207,212,232}
\definecolor{greeni}{RGB}{135,200,81}
\definecolor{greenii}{RGB}{216,235,207}

\tikzset{
  myiblock/.style 2 args={
    draw=white,
    fill=#1,
    line width=1pt,
    rounded corners,
    minimum height=1cm,
    align=center,
    text=white,
    font=\sffamily,
    text width=#2
  },
  myoblock/.style={
     matrix of nodes,
    fill=#1,
    rounded corners,
    align=center,
    inner xsep=10pt,
    draw=none,
    row sep=0.5cm
  },
  mylabel/.style={
    black,
    minimum height=0pt
    }
}

\begin{document}

\begin{tikzpicture}
\matrix (A) [myoblock={blueii}, nodes={myiblock={bluei}{2cm}}]
  {|[label={[mylabel]Structure 1}]|{Info about \\ one piece}\\
  Other\\
  };

\matrix (B) [myoblock={greenii}, nodes={myiblock={greeni}{2cm}},
   row sep=3pt, right=5mm of A.north east, anchor=north west]
  {|[label={[mylabel]Structure 2}]|Info object 1 \\
   Info Object 2\\
   Info Object 3\\
  };
\end{tikzpicture}

\end{document}
