

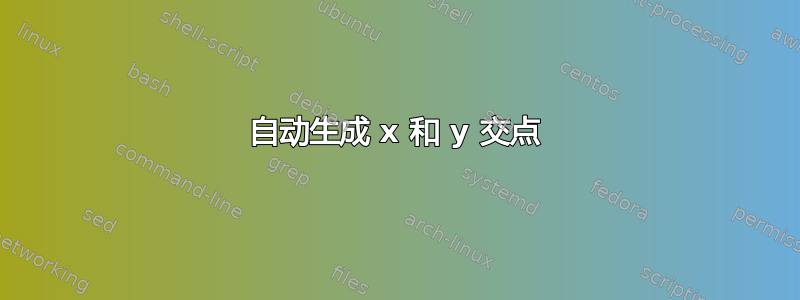
如何生成函数(例如多项式)的图像并自动指示 $x$ 和 $y$ 截距?我有一些代码可以生成 1 个 $x$ 截距和 $y$ 截距,但不生成第二个 $x$ 截距。如果根不同,它似乎可以工作,但如果有重复根,则不行。
作为一个相关问题,有没有比定义零函数和 $x = 0$ 处的线段更好的方法来找到这样的交点?
\documentclass[12pt]{article}
\usepackage{pgfplots}
\usetikzlibrary{intersections}
\usepackage{tikz}

\begin{document}


\begin{tikzpicture}
\begin{axis}[
width=10cm,
axis lines = middle,
scaled ticks=false,
no marks,
xmax=5,xmin=-5,
ymin=-10,ymax=10,
xlabel=$x$,ylabel=$y$,
xtick={-5,...,5},
ytick={-10,...,10},
]

\addplot+[name path=A] {(1/2)*(x+3)*(x+3)*(x-2)};
\addplot[name path = xaxis,color=black]{0};
\addplot[name path = yaxis,color=black] coordinates {(0,-10) (0,10)};
node[draw,fill,circle,inner sep=2pt] at (2,0) {};

\path[name intersections={of=A and xaxis}]
      node[draw,fill,circle,inner sep=2pt%,pin={above left:Intersection}]
      ]        at (intersection-1) {};
      node[draw,fill,circle,inner sep=2pt%,pin={above left:Intersection}]
      ]        at (intersection-2) {};
      node[draw,fill,circle,inner sep=2pt%,pin={above left:Intersection}]
      ]        at (intersection-3) {};
\path[name intersections={of=A and yaxis}]
      node[draw,fill,circle,inner sep=2pt%,pin={above left:Intersection}]
      ]        at (intersection-1) {};
\end{axis}
\end{tikzpicture}


\end{document}
答案1
;第二个交叉点没有标记,因为在绘制节点之前,您已经用 结束了路径intersection-2。因此,在有问题的代码中,即
\path[name intersections={of=A and xaxis}]
      node[draw,fill,circle,inner sep=2pt%,pin={above left:Intersection}]
      ]        at (intersection-1) {};
      node[draw,fill,circle,inner sep=2pt%,pin={above left:Intersection}]
      ]        at (intersection-2) {};
      node[draw,fill,circle,inner sep=2pt%,pin={above left:Intersection}]
      ]        at (intersection-3) {};
我认为最后两个节点被忽略了。甚至没有intersection-3,所以会引发错误。如果您删除第一个节点后的分号,即该代码片段中第三行的末尾,它就可以正常工作。
下面我使用了一种稍微不太冗长的方式来绘制与轴相交处的点。

\documentclass[12pt]{standalone}
\usepackage{pgfplots}
\usetikzlibrary{intersections}
\begin{document}
\begin{tikzpicture}
\begin{axis}[
width=10cm,
axis lines = middle,
scaled ticks=false,
no marks,
xmax=5,xmin=-5,
ymin=-10,ymax=10,
xlabel=$x$,ylabel=$y$,
xtick={-5,...,5},
ytick={-10,...,10},
clip mode=individual
]

\addplot+[name path=A,samples=100] {(1/2)*(x+3)*(x+3)*(x-2)};
\addplot[name path = xaxis,color=black]{0};
\addplot[name path = yaxis,color=black] coordinates {(0,-10) (0,10)};

\fill[name intersections={of=A and xaxis}]
     (intersection-1) circle[radius=3pt]
     (intersection-2) circle[radius=3pt];

\fill[name intersections={of=A and yaxis}]
     (intersection-1) circle[radius=3pt];
\end{axis}
\end{tikzpicture}