

我正在尝试画一个立方体,其表面标有全透视图。我看到这个问题但我正在寻找更多视角。任何帮助都非常感谢。以下是我的尝试:

\documentclass[border=5mm,tikz]{standalone}
\usepackage{mwe}
\usepackage{tikz}
\begin{document}
\begin{tikzpicture}
\draw[thick](2,2,0)--(0,2,0)--(0,2,2)--(2,2,2)--(2,2,0)--(2,0,0)--(2,0,2)--(0,0,2)--(0,2,2);
\draw[thick](2,2,2)--(2,0,2);
\draw[gray](2,0,0)--(0,0,0)--(0,2,0);
\draw[gray](0,0,0)--(0,0,2);
\draw(1,1,2) node{$Mol_{jl}$};
\draw(1,2,1) node{$Mol_{ijkl}$};
\draw(2,1,1) node[rotate=90] {$Mol_{kl}$};
\pgflowlevelscope{\pgftransformxscale{-1}}
\draw[gray!20](0.6,1,1) node[rotate=90]{$Mol_{ij}$};
\endpgflowlevelscope ;
 \pgflowlevelscope{\pgftransformxscale{-1}}
 \draw[gray!20](-1,1,0) node{$Mol_{ik}$};
\endpgflowlevelscope ;
 \end{tikzpicture}
 \end{document}
答案1
正如我在评论中指出的那样,必须倾斜和旋转文本才能产生等距视点(尽管我知道 OP 的绘图实际上是真正的透视图,而不是等距图)。OP 的代码已经考虑了文本旋转,所以我在这里所做的只是将其倾斜 +/-45 度,这是 OP 图像采用的近似等距感。
编辑 OP 的代码,将黑色物体放在前景;灰色物体放在后面。
\documentclass[border=5mm,tikz]{standalone}
\usepackage{fp,amssymb}
\newsavebox\foobox
\newcommand\slbox[2]{%
  \FPdiv{\result}{#1}{57.296}% CONVERT deg TO rad
  \FPtan{\result}{\result}%
  \slantbox[\result]{#2}%
}%
\newcommand{\slantbox}[2][30]{%
        \mbox{%
        \sbox{\foobox}{#2}%
        \hskip\wd\foobox
        \pdfsave
        \pdfsetmatrix{1 0 #1 1}%
        \llap{\usebox{\foobox}}%
        \pdfrestore
}}
\newcommand\rotslant[3]{\rotatebox{#1}{\slbox{#2}{#3}}}
\usepackage{mwe}
\usepackage{tikz}
\begin{document}
\begin{tikzpicture}
\pgflowlevelscope{\pgftransformxscale{-1}}
\draw[gray!20](0.8,.9,1) node[rotate=90]{\rotslant{0}{45}{\textcolor{gray!20}{$Mol_{ij}$}}};
\endpgflowlevelscope ;
 \pgflowlevelscope{\pgftransformxscale{-1}}
 \draw[gray!20](-1,1,0) node{$Mol_{ik}$};
\endpgflowlevelscope ;
\draw[gray](2,0,0)--(0,0,0)--(0,2,0);
\draw[gray](0,0,0)--(0,0,2);
\draw[thick](2,2,0)--(0,2,0)--(0,2,2)--(2,2,2)--(2,2,0)--(2,0,0)--(2,0,2)--(0,0,2)--(0,2,2);
\draw[thick](2,2,2)--(2,0,2);
\draw(1,1,2) node{$Mol_{jl}$};
\draw(1,2,1) node{\rotslant{0}{45}{$Mol_{ijkl}$}};
\draw(2,1,1) node[rotate=90] {\rotslant{0}{-45}{$Mol_{kl}$}};
 \end{tikzpicture}
 \end{document}

在这次修订中,我尝试通过垂直压缩侧面/顶面上的倾斜文本(通过\scalebox{1}[.75]{}在\slantbox定义中引入)来更正确地解释透视。当然,这会搞乱倾斜角度,必须手动修改才能重新获得正确的外观。在刻面上打印\square可以指示倾斜角度是否已正确选择。
\documentclass[border=5mm,tikz]{standalone}
\usepackage{fp,amssymb}
\newsavebox\foobox
\newcommand\slbox[2]{%
  \FPdiv{\result}{#1}{57.296}% CONVERT deg TO rad
  \FPtan{\result}{\result}%
  \slantbox[\result]{#2}%
}%
\newcommand{\slantbox}[2][30]{%
        \scalebox{1}[.7]{\mbox{%
        \sbox{\foobox}{#2}%
        \hskip\wd\foobox
        \pdfsave
        \pdfsetmatrix{1 0 #1 1}%
        \llap{\usebox{\foobox}}%
        \pdfrestore
}}}
\newcommand\rotslant[3]{\rotatebox{#1}{\slbox{#2}{#3}}}
\usepackage{mwe}
\usepackage{tikz}
\begin{document}
\begin{tikzpicture}
\pgflowlevelscope{\pgftransformxscale{-1}}
\draw[gray!20](0.8,.9,1) node[rotate=90]{\rotslant{0}{40}{\textcolor{gray!20}{$Mol_{ij}$}}};
\endpgflowlevelscope ;
 \pgflowlevelscope{\pgftransformxscale{-1}}
 \draw[gray!20](-1,1,0) node{$Mol_{ik}$};
\endpgflowlevelscope ;
\draw[gray](2,0,0)--(0,0,0)--(0,2,0);
\draw[gray](0,0,0)--(0,0,2);
\draw[thick](2,2,0)--(0,2,0)--(0,2,2)--(2,2,2)--(2,2,0)--(2,0,0)--(2,0,2)--(0,0,2)--(0,2,2);
\draw[thick](2,2,2)--(2,0,2);
\draw(1,1,2) node{$Mol_{jl}$};
\draw(1,2,1) node{\rotslant{0}{35}{$Mol_{ijkl}$}};
\draw(2,1,1) node[rotate=90] {\rotslant{0}{-40}{$Mol_{kl}$}};

 \end{tikzpicture}
 \end{document}

答案2
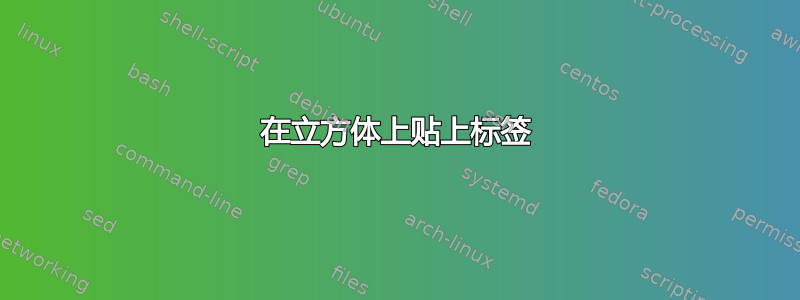
TikZ 不擅长 3D。为了在复杂情况下获得最佳效果,您应该使用专为 3D 绘图设计的软件。使用 TikZ 所能做的最好的事情是在 2D 中伪造 3D。对于简单的绘图,tikz-3dplot可以通过为您完成大量计算来帮助伪造。
例如,这是使用此包完成的立方体的一个版本:

取消注释行以查看用于构建图形的轴和坐标的位置。
\documentclass[border=5pt,tikz,multi]{standalone}
\usepackage{tikz-3dplot}
\begin{document}
\tdplotsetmaincoords{45}{135}
\begin{tikzpicture}[tdplot_main_coords, my label/.style={midway, sloped}]
%   \draw [->, help lines] (0,0,0) -- (4,0,0) node[anchor=north east]{$x$};
%   \draw [->, help lines] (0,0,0) -- (0,4,0) node[anchor=north west]{$y$};
%   \draw [->, help lines] (0,0,0) -- (0,0,4) node[anchor=south]{$z$};
  \path (1,-1,1) coordinate (a) -- (1,1,1) coordinate (b) -- (-1,1,1) coordinate (c) -- (-1,-1,1) coordinate (d) -- cycle (a) -- (1,-1,-1) coordinate (e) -- (1,1,-1) coordinate (f) -- (-1,1,-1) coordinate (g) -- (-1,-1,-1) coordinate (h) -- (e);
  \path [fill=magenta, fill opacity=.125] (a) -- (d) -- (h) -- (e) -- cycle;
  \path [fill=blue, fill opacity=.125] (c) -- (d) -- (h) -- (g) -- cycle;
  \path [fill=cyan, fill opacity=.125]   (e) -- (f) -- (g) -- (h) -- cycle;
  \path [fill=blue, fill opacity=.25] (a) -- (b) -- (f) -- (e) -- cycle;
  \path [fill=magenta, fill opacity=.25] (c) -- (b) -- (f) -- (g) -- cycle;
  \path [fill=cyan, fill opacity=.25] (a) -- (d) -- (c) -- (b) -- cycle;
  \draw [gray] (e) -- (h) edge (g) -- (d);
  \path  (1,-1,0) coordinate (i) -- (1,1,0) coordinate (j) node [my label]  {$Mol_{jl}$}
  (0,-1,1) coordinate (k) -- (0,1,1) coordinate (l) node [my label]  {$Mol_{ijkl}$}
  (0,1,-1) coordinate (m) -- (l) node [my label] {$Mol_{kl}$}
  (-1,1,0) coordinate (n) -- (-1,-1,0) coordinate (o) node [my label, gray, xscale=-1] {$Mol_{jk}$}
  (0,-1,-1) coordinate (p) -- (k)  node [my label, gray, yscale=-1] {$Mol_{ij}$}
  (m) -- (p) node [my label, gray, scale=-1] {$Mol_{??}$}
  ;
  \draw [thick, line join=round] (a) -- (b) -- (f) -- (e) -- cycle (a) -- (d) -- (c) -- (b) -- cycle (b) -- (c) -- (g) -- (f) -- cycle;
%   \foreach \i in {a,b,...,p} \node [red,font=\tiny] at (\i) {\i};
\end{tikzpicture}
\end{document}