

我正在循环遍历多个文件并在 pgfplots 中的轴上绘制内容。我想将每个条目绘制为不同的颜色(例如,蓝色阴影)。虽然绘图工作正常,但我很难在每个“for”循环中更改颜色。这里有类似的问题,但我无法让任何一个工作得相当好。
这是一个简单的例子...
\documentclass{article}
\usepackage{color}
\usepackage{pgfplots}
\usepackage{pgfplotstable}
\pgfplotsset{width=7cm,compat=1.3}
\usepackage{tikz}

\begin{document}
\begin{figure}
   \centering
   \begin{tikzpicture}
      \begin{loglogaxis}
         \foreach \n in {1,...,20} {
            \addplot[
               color=blue,
            ] table {data/datafile_\n.dat};
         }
      \end{loglogaxis}
   \end{tikzpicture}
\end{figure}
\end{document}
我想要类似的东西
color=blue!\n!white
但这似乎对图没有任何影响。更具体地说,我想对计数器执行一些操作\n以更好地控制颜色。在摸索了类似的问题和 pgfplots 手册后,我尝试\foreach用以下代码替换循环:
\pgfplotsinvokeforeach{1,...,20}{
这让我可以做类似的事情color=blue!#1!white,但如果我想用类似的东西操作柜台本身
\pgfmathtruncatemacro{\k}{#1*5}
然后使用color=blue!\k!white,我没有得到预期的结果 - 颜色保持不变。
对 pgfplots 和 tikz 非常陌生,因此非常感谢任何帮助!
答案1
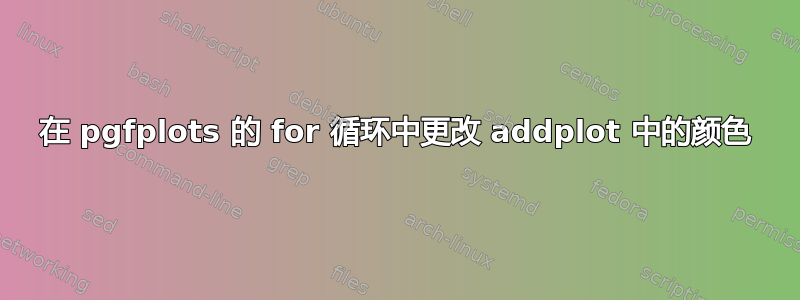
你是这个意思吗?
\documentclass[border=2mm]{standalone}
\usepackage{color}
\usepackage{pgfplots}
    \pgfplotsset{
        compat=1.3,
    }
\usepackage{tikz}
\begin{document}
\begin{tikzpicture}
    \begin{axis}
        % use this \foreach variant to cycle through the number of items
        \pgfplotsforeachungrouped \n in {1,...,10} {
                % manipulate the counter and store it in `\i'
                \pgfmathtruncatemacro{\i}{10*\n}
            % then use this construct as written in the manual in section 8.1
            % on page 519 (v1.13)
            \edef\temp{\noexpand%
            \addplot[
                color=blue!\i,
            ] coordinates { (0,\n) (1,\n) };
            }\temp
        }
        % test, if it worked by adding some dummy points with the expected colors
        \addplot [blue!10,only marks,mark=*]  coordinates { (0.5,1) };
        \addplot [blue!100,only marks,mark=*] coordinates { (0.5,10) };
    \end{axis}
\end{tikzpicture}
\end{document}
