

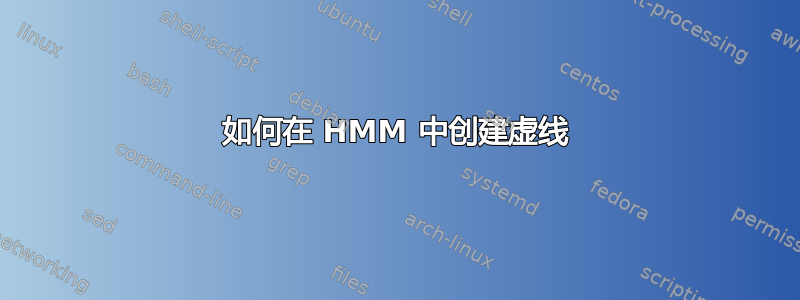
下面的代码描述了一个隐马尔可夫过程。有人能告诉我如何在两行圆圈之间添加虚线,即用虚线将观察空间和潜在空间分开吗?如果整个图片的高度不变就更好了。
下面的代码是我目前拥有的,而图片是所需的。

\documentclass{article}

\title{}
\author{Author}

\usepackage{amsmath}
\usepackage{fullpage}
\usepackage{graphicx}
\usepackage{tikz}
\usetikzlibrary{fit,positioning,arrows,automata}

\begin{document}
\maketitle

\begin{figure}[!htb]
\begin{tikzpicture}
\tikzstyle{main}=[circle, minimum size = 5mm, thick, draw =black!80, node distance = 10mm]
\tikzstyle{connect}=[-latex, thick]
\tikzstyle{box}=[rectangle, draw=black!100]
  \node[box,draw=white!100] (Latent) {\textbf{Latent}};
  \node[main] (L1) [right=of Latent] {$L_1$};
  \node[main] (L2) [right=of L1] {$L_2$};
  \node[main] (L3) [right=of L2] {$L_3$};
  \node[main] (Lt) [right=of L3] {$L_t$};
  \node[box,draw=white!100] (Observed) [below=of Latent] {\textbf{Observed}};
  \node[main,fill=black!10] (O1) [right=of Observed,below=of L1] {$O_1$};
  \node[main,fill=black!10] (O2) [right=of O1,below=of L2] {$O_2$};
  \node[main,fill=black!10] (O3) [right=of O2,below=of L3] {$O_3$};
  \node[main,fill=black!10] (Ot) [right=of O3,below=of Lt] {$O_t$};
  \path (L3) -- node[auto=false]{\ldots} (Lt);
  \path (L1) edge [connect] (L2)
        (L2) edge [connect] (L3)
        (L3) -- node[auto=false]{\ldots} (Lt);
  \path (O1) edge [connect] (O2)
        (O2) edge [connect] (O3)
        (O3) -- node[auto=false]{\ldots} (Ot);
  \path (L1) edge [connect] (O1);
  \path (L2) edge [connect] (O2);
  \path (L3) edge [connect] (O3);
  \path (Lt) edge [connect] (Ot);
  \draw[dashed]  [below=of L1,above=of O1];
\end{tikzpicture}
\end{figure}

\end{document}
答案1
为了更好地放置节点Observed,进行了一些小小的重新排列,并使用calc库来确保水平线。
还请注意,定位键不是“累积的”,如果您说left=of a, below=of b,则该left键将被忽略。不过,这对您的示例没有影响。
\documentclass{article}
\usepackage{tikz}
\usetikzlibrary{fit,positioning,arrows,automata,calc}
\tikzset{
  main/.style={circle, minimum size = 5mm, thick, draw =black!80, node distance = 10mm},
  connect/.style={-latex, thick},
  box/.style={rectangle, draw=black!100}
}
\begin{document}
\begin{tikzpicture}
  \node[box,draw=white!100] (Latent) {\textbf{Latent}};
  \node[main] (L1) [right=of Latent] {$L_1$};
  \node[main] (L2) [right=of L1] {$L_2$};
  \node[main] (L3) [right=of L2] {$L_3$};
  \node[main] (Lt) [right=of L3] {$L_t$};
  \node[main,fill=black!10] (O1) [below=of L1] {$O_1$};
  \node[main,fill=black!10] (O2) [below=of L2] {$O_2$};
  \node[main,fill=black!10] (O3) [below=of L3] {$O_3$};
  \node[main,fill=black!10] (Ot) [below=of Lt] {$O_t$};
  \node[box,draw=white!100,left=of O1] (Observed) {\textbf{Observed}};
  \path (L3) -- node[auto=false]{\ldots} (Lt);
  \path (L1) edge [connect] (L2)
        (L2) edge [connect] (L3)
        (L3) -- node[auto=false]{\ldots} (Lt);
  \path (O1) edge [connect] (O2)
        (O2) edge [connect] (O3)
        (O3) -- node[auto=false]{\ldots} (Ot);
  \path (L1) edge [connect] (O1);
  \path (L2) edge [connect] (O2);
  \path (L3) edge [connect] (O3);
  \path (Lt) edge [connect] (Ot);

  % draw the dashed line
  \draw [dashed, shorten >=-1cm, shorten <=-1cm]
      ($(Latent)!0.5!(Observed)$) coordinate (a) -- ($(Lt)!(a)!(Ot)$);
\end{tikzpicture}
\end{document}

答案2
对您的代码进行一点补充,使这条线(弯曲的线固定)

    \documentclass{article}

\title{}
\author{Author}

\usepackage{amsmath}
\usepackage{fullpage}
\usepackage{graphicx}
\usepackage{tikz}
\usetikzlibrary{fit,positioning,arrows,automata}

\begin{document}
\maketitle

\begin{figure}[!htb]
\begin{tikzpicture}
\clip (-2.5,-2.5) rectangle (8.5,2.5);
\tikzstyle{main}=[circle, minimum size = 5mm, thick, draw =black!80, node distance = 10mm]
\tikzstyle{connect}=[-latex, thick]
\tikzstyle{box}=[rectangle, draw=black!100]
  \node[box,draw=white!100] (Latent) {\textbf{Latent}};
  \node[main] (L1) [right=of Latent] {$L_1$};
  \node[main] (L2) [right=of L1] {$L_2$};
  \node[main] (L3) [right=of L2] {$L_3$};
  \node[main] (Lt) [right=of L3] {$L_t$};
  \node[box,draw=white!100] (Observed) [below=of Latent] {\textbf{Observed}};
    \node[main,fill=black!10] (O1) [right=of Observed,below=of L1] {$O_1$};
  \node[main,fill=black!10] (O2) [right=of O1,below=of L2] {$O_2$};
  \node[main,fill=black!10] (O3) [right=of O2,below=of L3] {$O_3$};
  \node[main,fill=black!10] (Ot) [right=of O3,below=of Lt] {$O_t$};
  \path (L3) -- node[auto=false]{\ldots} (Lt);
  \path (L1) edge [connect] (L2)
        (L2) edge [connect] (L3)
        (L3) -- node[auto=false]{\ldots} (Lt);
  \path (O1) edge [connect] (O2)
        (O2) edge [connect] (O3)
        (O3) -- node[auto=false]{\ldots} (Ot);
  \path (L1) edge [connect] (O1);
  \path (L2) edge [connect] (O2);
  \path (L3) edge [connect] (O3);
  \path (Lt) edge [connect] (Ot);
  \draw[dashed]  [below=of L1,above=of O1];

\path (Latent) -- (Observed) coordinate[midway](l44);
\node (l43) [left=of l44] {};
\path (Lt) -- (Ot) coordinate[midway](l444);
\node (l433) [right=of l444] {};
\draw[dashed,thick] (l43) to ++(0:180);

\end{tikzpicture}
\end{figure}

\end{document}