

我根据在互联网上找到的代码构建了一个饼图,并且我已经尝试进行一些更改,因为它很混乱,而且当百分比太小(<3%)时,我想要有外部文本和一条从内部到外部文本的线。
我的代码是:
\newcommand{\slice}[4]{
\pgfmathparse{0.5*#1+0.5*#2}
\let\midangle\pgfmathresult
% slice
\draw[thick,fill=black!10] (0,0) -- (#1:1) arc (#1:#2:1) -- cycle;
% outer label
\node[label=\midangle:#4] at (\midangle:1) {};
% inner label
\pgfmathparse{min((#2-#1-10)/110*(-0.3),0)}
\let\temp\pgfmathresult
\pgfmathparse{max(\temp,-0.5) + 0.8}
\let\innerpos\pgfmathresult
\node at (\midangle:\innerpos) {#3};
}
\begin{figure} [!htbp]
\begin{center}
\begin{tikzpicture}[scale=3]
\newcounter{c}
\newcounter{d}
\foreach \p/\t in {18/Absolute Return Bonds, 8/Cash, 1/Eurozone equities, 6/Global Equities, 1/Hedge Funds (Mercer MLAS fund), 29/Index-Linked euro govts (AS), 7/Private Equity, 4/Euro Corporate Bonds (>10yrs), 25/Property, 2/Others}
{
\setcounter{a}{\value{b}}
\addtocounter{b}{\p}
\slice{\thea/100*360}
{\theb/100*360}
{\p\%}{\t}
}
\end{tikzpicture}
\end{center}
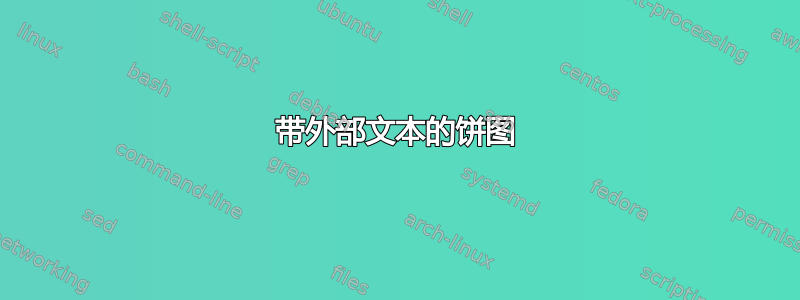
\caption{Alocation of the amount invested in each sub-asset class}
\label{fi2}
\end{figure}
您能给我一些提示吗?:)
答案1
请参阅下文增强型解决方案
这里我提出了一些修改。首先,我将饼图内的标签改为\ifnum\p>3\relax\p\%\fi。这样,只有当百分比大于 3% 时,它才会将“number%”标签放在饼图内。否则,您应该将百分比作为标签本身的明确部分。
其次,我使用\stackon和\stackunder将规则扩展到饼图。
\documentclass{article}
\newcounter{a}
\newcounter{b}
\usepackage{tikz,stackengine}
\def\stackalignment{r}
\setstackgap{S}{2pt}
\begin{document}

\newcommand{\slice}[4]{
        \pgfmathparse{0.5*#1+0.5*#2}
        \let\midangle\pgfmathresult

        % slice
        \draw[thick,fill=black!10] (0,0) -- (#1:1) arc (#1:#2:1) -- cycle;

        % outer label
        \node[label=\midangle:#4] at (\midangle:1) {};

        % inner label
        \pgfmathparse{min((#2-#1-10)/110*(-0.3),0)}
        \let\temp\pgfmathresult
        \pgfmathparse{max(\temp,-0.5) + 0.8}
        \let\innerpos\pgfmathresult
        \node at (\midangle:\innerpos) {#3};
    }
    \begin{figure} [!htbp]
    \begin{center}
        \begin{tikzpicture}[scale=3]

        \newcounter{c}
        \newcounter{d}
        \foreach \p/\t in {
          18/Absolute Return Bonds,
          8/Cash,
          1/\stackunder{Eurozone equities (1\%)}{\rule{.8pt}{4.5ex}},
          6/\stackunder{Global Equities}{\rule{.8pt}{2.5ex}},
          1/\stackunder{Hedge Funds (Mercer MLAS fund)(1\%)}{\rule{.8pt}{1ex}},
          29/Index-Linked euro govts (AS),
          7/Private Equity,
          4/\stackon{Euro Corporate Bonds ($>$10yrs)}{\rule{.8pt}{1.5ex}},
          25/Property,
          2/Others (2\%)}
        {
            \setcounter{a}{\value{b}}
            \addtocounter{b}{\p}
            \slice{\thea/100*360}
            {\theb/100*360}
            {\ifnum\p>3\relax\p\%\fi}{\t}
        }

        \end{tikzpicture}
    \end{center}

    \caption{Alocation of the amount invested in each sub-asset class}
    \label{fi2}
\end{figure}
\end{document}

增强型解决方案
在这里我介绍
\pielabelon[<H-shift>]{<Label text>}{<stem-height>}
\pielabelunder[<H-shift>]{<Label text>}{<stem-height>}
妇女权利委员会:
\documentclass{article}
\newcounter{a}
\newcounter{b}
\usepackage{tikz,stackengine}
\def\stackalignment{r}
\newcommand\pielabelon[3][0pt]{%
  \abovebaseline[#3]{#2%
  \makebox[-\dimexpr8pt+#1]{\smash{%
  \stackunder{}{\rule{1pt}{\dimexpr#3+2.5ex}}}}}
}
\newcommand\pielabelunder[3][0pt]{%
  \belowbaseline[#3]{#2%
  \makebox[-\dimexpr8pt+#1]{\smash{%
  \stackon{\rule{0pt}{1.3ex}}{\rule{1pt}{\dimexpr#3+2.5ex}}}}}
}
\begin{document}

\newcommand{\slice}[4]{
        \pgfmathparse{0.5*#1+0.5*#2}
        \let\midangle\pgfmathresult

        % slice
        \draw[thick,fill=black!10] (0,0) -- (#1:1) arc (#1:#2:1) -- cycle;

        % outer label
        \node[label=\midangle:#4] at (\midangle:1) {};

        % inner label
        \pgfmathparse{min((#2-#1-10)/110*(-0.3),0)}
        \let\temp\pgfmathresult
        \pgfmathparse{max(\temp,-0.5) + 0.8}
        \let\innerpos\pgfmathresult
        \node at (\midangle:\innerpos) {#3};
    }
    \begin{figure} [!htbp]
    \begin{center}
        \begin{tikzpicture}[scale=3]

        \newcounter{c}
        \newcounter{d}
        \foreach \p/\t in {
          18/Absolute Return Bonds,
          8/Cash,
          1/\pielabelon{Eurozone equities (1\%)}{4.5ex},
          6/\pielabelon{Global Equities}{2.5ex},
          1/\pielabelon[6pt]{Hedge Funds (Mercer MLAS fund)(1\%)}{1ex},
          29/Index-Linked euro govts (AS),
          7/Private Equity,
          4/\pielabelunder[4pt]{Euro Corporate Bonds ($>$10yrs)}{2.5ex},
          25/Property,
          2/Others (2\%)}
        {
            \setcounter{a}{\value{b}}
            \addtocounter{b}{\p}
            \slice{\thea/100*360}
            {\theb/100*360}
            {\ifnum\p>3\relax\p\%\fi}{\t}
        }

        \end{tikzpicture}
    \end{center}

    \caption{Alocation of the amount invested in each sub-asset class}
    \label{fi2}
\end{figure}
\end{document}
