

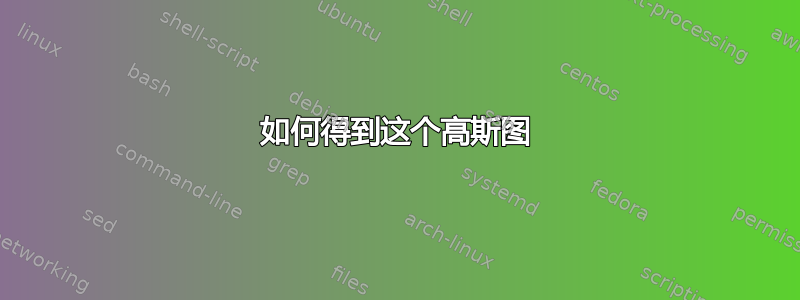
我想要得到这个高斯图,其中框位于轴的底部,如下所示:

这是我目前拥有的代码:
\documentclass[11pt]{book}
\usepackage{pgfplots}
\pgfmathdeclarefunction{gauss}{2}{%
  \pgfmathparse{1/(#2*sqrt(2*pi))*exp(-((x-#1)^2)/(2*#2^2))}%
}

\begin{document}

\begin{figure}
\begin{center}
\begin{tikzpicture}
\begin{axis}[
  no markers,
  domain=-6:6,
  samples=100,
  axis lines*=left,
  xlabel=$x$,
  ylabel=$G(x)$,
 % every axis y label/.style={at=(current axis.above origin),anchor=south},
  every axis x label/.style={at=(current axis.right of origin),anchor=west},
  height=5cm, width=12cm,
  %xtick=\empty,
  %ytick=\empty,
  enlargelimits=false, clip=false, axis on top,
  grid = major,
  ]

\addplot [very thick,blue!50!black] {gauss(0,1.5)};

\end{axis}
\end{tikzpicture}
\caption{Bell Shaped Gaussian Distribution}
\end{center}
\end{figure}

\end{document}
答案1
我的第一个方法是手动绘制框:

\documentclass[11pt]{book}
\usepackage{pgfplots}
\usetikzlibrary{positioning,calc}
\pgfmathdeclarefunction{gauss}{2}{%
  \pgfmathparse{1/(#2*sqrt(2*pi))*exp(-((x-#1)^2)/(2*#2^2))}%
}

\begin{document}

\begin{figure}
\begin{center}
\begin{tikzpicture}[%
    G node/.style={minimum width=1cm,align=center},%
]
\begin{axis}[
  no markers,
  domain=-6:6,
  samples=100,
  axis lines*=left,
  xlabel=$x$,
  ylabel=$G(x)$,
 % every axis y label/.style={at=(current axis.above origin),anchor=south},
  every axis x label/.style={at=(current axis.right of origin),anchor=west},
  height=5cm, width=12cm,
  %xtick=\empty,
  %ytick=\empty,
  enlargelimits=false, clip=false, axis on top,
  grid = major,
  ]

\addplot [very thick,blue!50!black] {gauss(0,1.5)};

\begin{scope}[yshift=-1cm] % shift boxes here
\node[G node,anchor=west] (L)  at (rel axis cs: 0,0) {$G(n)$};
\node[G node,anchor=east] (R)  at (rel axis cs: 1,0) {$G(n)$};
\node[G node]             (C)  at (rel axis cs: .5,0) {$G(0)$};
\node[G node,anchor=west] (CR) at (C.east) {$G(1)$};
\node[G node,anchor=east] (CL) at (C.west) {$G(1)$};
\node[] at ($(L)!.5!(CL)$) {$\dots$};
\node[] at ($(R)!.5!(CR)$) {$\dots$};
% draw lines
\draw (L.south west) rectangle (R.north east);
\draw (L.north east) -- (L.south east);
\draw (CL.north west) -- (CL.south west);
\draw (CL.north east) -- (CL.south east);
\draw (CR.north west) -- (CR.south west);
\draw (CR.north east) -- (CR.south east);
\draw (R.north west) -- (R.south west);
\end{scope}
\end{axis}

\end{tikzpicture}
\end{center}
\end{figure}
\end{document}
正如 Guilherme Z. Santos 在评论中提到的,您可以添加轴选项xticklabel=\empty来删除 x 轴上的刻度。
