

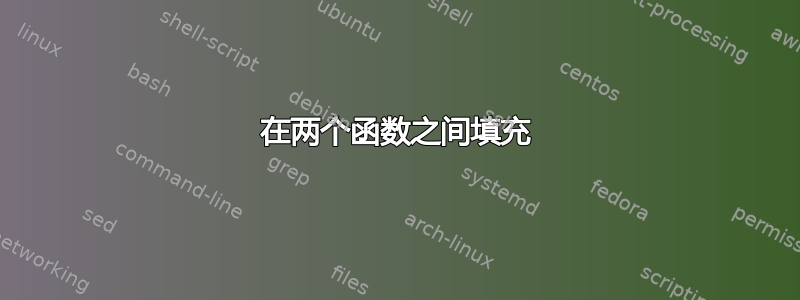
在下面的例子中,我试图呈现两张图片,一张是波浪轮廓和船舶轮廓之间的阴影(成功),第二张图片是水线\zeta=0和扭曲的水下船体轮廓之间的阴影(不成功)......我使用了相同的fill between语法并仔细阅读了许多帖子,但似乎找不到我的错误......有人能看出来吗?
% Hull Mapping Diagram
% Author: Richard W. Greenwood
\documentclass{article}
\usepackage{tikz}
\usepackage{pgfplots}
%%%<
\usepackage{verbatim}
\usepackage[active,tightpage]{preview}
\usetikzlibrary{calc}
\usepackage{amssymb}
\PreviewEnvironment{tikzpicture}
\setlength{\PreviewBorder}{10pt}%
%%%>
\usepackage{pgfplots}
\pgfplotsset{compat=1.11}
\usepgfplotslibrary{fillbetween}
\usetikzlibrary{patterns}
\usetikzlibrary{intersections}
\pgfdeclarelayer{bg}
\pgfsetlayers{bg,main}


\begin{document}


\begin{comment}
:Title: Hull Mapping
:Author: Richard W. Greenwood
\end{comment}

\pgfmathdeclarefunction{wave}{0}{\pgfmathparse{-0.25*cos(\x r)}}
\pgfmathdeclarefunction{tr_wave}{0}{\pgfmathparse{0}}
\pgfmathdeclarefunction{deck}{0}{\pgfmathparse{0.5}}
\pgfmathdeclarefunction{tr_deck}{0}{\pgfmathparse{0.5+0.25*cos(\x r)}}
\pgfmathdeclarefunction{buttock}{0}{\pgfmathparse{-0.5-0.125*(\x)}}
\pgfmathdeclarefunction{skeg}{0}{\pgfmathparse{-8.2-3.9*(\x)}}
\pgfmathdeclarefunction{keel}{0}{\pgfmathparse{-0.5}}
\pgfmathdeclarefunction{stem}{0}{\pgfmathparse{-10.5+3.5*(\x)}}

\pgfplotsset{width=10cm, compat=1.10}

\begin{tikzpicture}
[declare function={keelp(\x)=
(\x>=0.94*pi)*(-10.5+3.5*(\x))+and
(\x>-0.66*pi,\x<0.94*pi)*(-0.5)+
(\x<=-0.66*pi)*(-0.5+\x*-0.125);}]

[yscale=1.0]
\begin{axis}[
    axis equal image,
    xtick       = \empty,
    ytick       = \empty,
    axis lines =middle,
    samples     = 160,
    domain      = -1.5*pi:1.5*pi,
    xmin = -1.3*pi, xmax = 1.4*pi,
    ymin = -0.75, ymax = 1.35,
    title style={at={(0.5,-0.2)},anchor=north},
 title = actual immersed hull surface,
  ]
\addplot[name path=keelprofile, red,domain={-pi:pi}]{keelp(x)};
\addplot[name path=wave, blue, thick, domain={-1.25*pi:1.25*pi} ] {wave};
%\addplot[name path=tr_wave, blue, thick, domain={-1.25*pi:1.25*pi} ] {tr_wave};
%\addplot[name path=tr_profile, green, thick, domain={-pi:0.97*pi} ] {-(wave-keelprofile(x))};
%\addplot[name path=tr_deck, green, thin, mark=none, domain={-1.*pi:1.*pi}] {tr_deck};
\addplot[name path=deck, red, thin, mark=none, domain={-1.*pi:1.*pi}] {deck};
\addplot[name path=transom,red, thin] coordinates {(-pi,-0.1)(-pi,0.5)};
\addplot[black, thin] coordinates {(0,-0.75)(0,0.9)}node[anchor=south west,black]{$z$};
\addplot[black, thin] coordinates {(-1.3*pi,0)(1.35*pi,0)}node[anchor=south,black]{$x$};
\addplot [pattern=north west lines, pattern color=brown!50]fill between[ of = wave and keelprofile, soft clip={domain=-pi:0.97*pi}];
  \end{axis}
\end{tikzpicture}

\begin{tikzpicture}
[declare function={
keelp(\x)=
(\x>=0.94*pi)*(-10.5+3.5*(\x))+and
(\x>-0.66*pi,\x<0.94*pi)*(-0.5)+
(\x<=-0.66*pi)*(-0.5+\x*-0.125);
trp(\x)=
(\x>=0.94*pi)*(-10.5+3.5*(\x)+0.25*cos(\x r))+and
(\x>-0.66*pi,\x<0.94*pi)*(-0.5+0.25*cos(\x r))+
(\x<=-0.66*pi)*(-0.5+\x*-0.125+0.25*cos(\x r));
}]
[yscale=1.0]
\begin{axis}[
    axis equal image,
    xtick       = \empty,
    ytick       = \empty,
    axis lines =middle,
    samples     = 160,
    domain      = -1.5*pi:1.5*pi,
    xmin = -1.3*pi, xmax = 1.4*pi,
    ymin = -0.75, ymax = 1.35,
    title style={at={(0.5,-0.2)},anchor=north},
 title = transformed immersed hull surface,
  ]
\addplot[name path=tr_wave, blue, thick, domain={-1.25*pi:1.25*pi} ] {tr_wave};
%\addplot[name path=tr_profile, red, thin, domain={-pi:pi} ] {keelp(x)-wave};
\addplot[name path=trp, red, thin, domain={-pi:pi} ] {trp(x)};
\addplot[name path=tr_deck, red, thin, mark=none, domain={-1.*pi:1.*pi}] {tr_deck};
\addplot[name path=tr_transom,red, thin] coordinates {(-pi,-0.35)(-pi,0.25)};
\addplot[black, thin] coordinates {(0,-0.75)(0,0.9)}node[anchor=south west,black]{$\xi$};
\addplot[black, thin] coordinates {(-1.3*pi,0)(1.35*pi,0)}node[anchor=south,black]{$x$};
\addplot [pattern=north west lines, pattern color=brown!50]fill between[ of = tr_wave and trp, soft clip={domain=-pi:0.97*pi}];
  \end{axis}
\end{tikzpicture}

\end{document}

答案1
更新答案
报告的错误已修复,随着 PGFPlots v1.16 的发布,您的示例直接给出了预期的结果。
原始答案
这与已经报告的漏洞在 PGFPlots 中,当fill between与一起使用时soft clip,您会碰到轴边界。因此解决方案很简单:将值设置ymin为较低的值,例如,-0.76您将获得所需的结果。
这里我只展示了代码相关部分的结果(加上一些额外的内容来证明这种奇怪的行为是从哪里来的)。
% used PGFPlots v1.14
\documentclass[border=5pt]{standalone}
\usepackage{pgfplots}
    \usetikzlibrary{
        patterns,
        pgfplots.fillbetween,
    }
    \pgfplotsset{
        compat=1.11,
        width=10cm,
    }
    \pgfmathdeclarefunction{tr_wave}{0}{\pgfmathparse{0}}
\begin{document}
    \begin{tikzpicture}[
        declare function={
            trp(\x) =
                (\x>=0.94*pi)*(-10.5+3.5*(\x)+0.25*cos(\x r))
                + and(\x>-0.66*pi,\x<0.94*pi)*(-0.5+0.25*cos(\x r))
                + (\x<=-0.66*pi)*(-0.5+\x*-0.125+0.25*cos(\x r))
            ;
        },
    ]
        \begin{axis}[
            axis equal image,
            xtick=\empty,
            ytick=\empty,
            axis lines =middle,
            samples=160,
            xmin=-1.3*pi,
            xmax=1.4*pi,
            % -----------------------------------------------------------------
            % that is the important line here
            % it is equal or greater than the minimum value of one of the
            % `fill between' pathes and thus causes the strange behaviour
            % in combination with the `soft clip' path
            ymin=-0.76,         % <-- changed from -0.75
            % -----------------------------------------------------------------
            ymax=1.35,
            title style={
                at={(0.5,-0.2)},
                anchor=north,
            },
            title=transformed immersed hull surface,
        ]
            \addplot [
                name path=tr_wave,
                blue,
                thick,
                domain={-1.25*pi:1.25*pi},
            ] {tr_wave};
            \addplot [
                name path=trp,
                red,
                thin,
                domain={-pi:pi},
            ] {trp(x)};

            \addplot [
                pattern=north west lines,
                pattern color=brown!50,
            ] fill between [
                of=tr_wave and trp,
                % to prove that the soft clip is responsible for the bug
                % use e.g. a `ymin' value between -0.70 and -0.75,
                % comment the `soft clip' path and you will get the desired result
                soft clip={
                    domain=-pi:0.97*pi,
%                    % comment the previous line and use the next one which
%                    % should give the same result as when no `soft clip` path
%                    % is used
%                    % (same domain as `tr_wave')
%                    domain=-1.25*pi:1.25*pi,
                },
            ];

            % this line shows you the previous `ymin' and that it touched one
            % of the pathes relevant for the `fill between'
            \draw [help lines, dashed]
                (\pgfkeysvalueof{/pgfplots/xmin},-0.75)
                -- (\pgfkeysvalueof{/pgfplots/xmax},-0.75)
            ;
        \end{axis}
    \end{tikzpicture}
\end{document}
