

我正在尝试实现发散色阶;单元格应根据内部值进行着色。已经实现了类似的效果这里用于连续颜色标度。
但是,我想要一个“中点”,即从蓝色到白色再到红色的颜色尺度。
这是一个最小工作示例确实不是实现了我想要的。我所寻找的是在注释中描述的,但代码不起作用。那里出了什么问题?
\documentclass[12pt]{article}
\usepackage[table]{xcolor}
\usepackage{pgfplotstable}

\begin{document}
    \pgfplotstableset{
        color cells/.style={
            col sep=comma,
            string type,
            postproc cell content/.code={%
                    \pgfkeysalso{@cell
                    % content=\rule{0cm}{2.4ex}\cellcolor{\pgfmathtruncatemacro\number{##1}\ifnum\number>50 red!##1!white\else blue!##1!white\fi}}%
                    content=\rule{0cm}{2.4ex}##1}%
                    },
            columns/x/.style={
                column name={},
                postproc cell content/.code={}
            }
        }
    }

    \begin{table}\caption{Correlation}
        \centering
        \pgfplotstabletypeset[color cells]{
            0,55,100,0,0,0,7,16,10,19,21,29
            43,43,90,17,87,8,20,81,43,20,18,31
            67,21,50,0,70,5,6,5,26,23,20,25
            11,40,60,63,7,14,10,17,24,22,15,38
            25,0,33,50,17,16,9,10,22,6,19,22
            22,5,0,0,2,50,0,3,8,7,13,18
            0,50,30,40,50,1,20,13,3,12,5,11
        }
    \end{table}
\end{document}

答案1
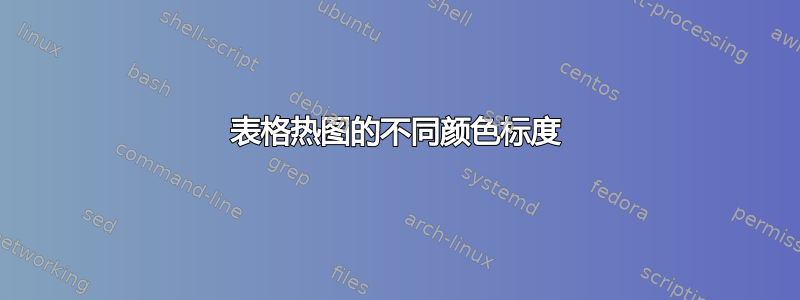
我在这里提出的解决方案原则上与 Christian Feuersänger 提供的解决方案相同这里,并简单地将使用的颜色图更改为“发散”颜色图并设置适当的color cells/min和color cells/max值。在这里,为简单起见,我使用了RdBu著名的 ColorBrewer 方案的颜色图,该方案在 PGFPlots 中也可用。
有关详细信息,请查看代码中的注释
\documentclass[border=5pt]{standalone}
\usepackage{colortbl}
\usepackage{pgfplots}
\usepackage{pgfplotstable}
    % for simplicity I use the `RdBu' colormap to have a read over white to blue
    % colormap
    \usetikzlibrary{pgfplots.colorbrewer}
    \pgfplotsset{
        colormap/RdBu,
    }
    % -------------------------------------------------------------------------
    % copied from <https://tex.stackexchange.com/a/83865/95441>
    \pgfplotstableset{
        /color cells/min/.initial=0,
        /color cells/max/.initial=1000,
        /color cells/textcolor/.initial=,
        %
        % Usage: 'color cells={min=<value which is mapped to lowest color>,
        %   max = <value which is mapped to largest>}
        color cells/.code={%
            \pgfqkeys{/color cells}{#1}%
            \pgfkeysalso{%
                postproc cell content/.code={%
                    %
                    \begingroup
                    %
                    % acquire the value before any number printer changed
                    % it:
                    \pgfkeysgetvalue{/pgfplots/table/@preprocessed cell content}\value
                    \ifx\value\empty
                        \endgroup
                    \else
                    \pgfmathfloatparsenumber{\value}%
                    \pgfmathfloattofixed{\pgfmathresult}%
                    \let\value=\pgfmathresult
                    %
                    % map that value:
                    \pgfplotscolormapaccess
                        [\pgfkeysvalueof{/color cells/min}:\pgfkeysvalueof{/color cells/max}]
                        {\value}
                        {\pgfkeysvalueof{/pgfplots/colormap name}}%
                    % now, \pgfmathresult contains {<R>,<G>,<B>}
                    %
                    % acquire the value AFTER any preprocessor or
                    % typesetter (like number printer) worked on it:
                    \pgfkeysgetvalue{/pgfplots/table/@cell content}\typesetvalue
                    \pgfkeysgetvalue{/color cells/textcolor}\textcolorvalue
                    %
                    % tex-expansion control
                    % see https://tex.stackexchange.com/questions/12668/where-do-i-start-latex-programming/27589#27589
                    \toks0=\expandafter{\typesetvalue}%
                    \xdef\temp{%
                        \noexpand\pgfkeysalso{%
                            @cell content={%
                                \noexpand\cellcolor[rgb]{\pgfmathresult}%
                                \noexpand\definecolor{mapped color}{rgb}{\pgfmathresult}%
                                \ifx\textcolorvalue\empty
                                \else
                                    \noexpand\color{\textcolorvalue}%
                                \fi
                                \the\toks0 %
                            }%
                        }%
                    }%
                    \endgroup
                    \temp
                    \fi
                }%
            }%
        }
    }
    % -------------------------------------------------------------------------
\begin{document}
    \pgfplotstabletypeset[
        color cells={
            % provide suitable `min' and `max' values.
            % The mean value of these will show as white
            min=0,
            max=100,
        },
        col sep=comma,
    ]{
        0,55,100,0,0,0,7,16,10,19,21,29
        43,43,90,17,87,8,20,81,43,20,18,31
        67,21,50,0,70,5,6,5,26,23,20,25
        11,40,60,63,7,14,10,17,24,22,15,38
        25,0,33,50,17,16,9,10,22,6,19,22
        22,5,0,0,2,50,0,3,8,7,13,18
        0,50,30,40,50,1,20,13,3,12,5,11
    }
\end{document}
