

如何自动化下一个代码使用\foreach或任何其他方法绘制与两条直线相交的折线
\documentclass[tikz, border=1cm]{standalone}
\begin{document}
    \begin{tikzpicture}
            \draw [fill=gray!50] (180:1) arc (180:360:1) -- cycle;
            \draw [thick] (-0.5,0) -- (0,4) -- (0.5,0);
            % how to automatize next code using \foreach or any other  methods
            \draw (-0.5,0) -- ++(30:1.077) -- ++(150:0.90)  -- ++ (30:0.8)  -- ++(150:0.7)  -- ++ (30:0.6) -- ++(150:0.53) -- ++ (30:0.45) --  ++(150:0.38) -- ++ (30:0.33) -- ++(150:0.29) -- ++ (30:0.26) -- ++(150:0.23) -- ++ (30:0.205) -- ++(150:0.18);
    \end{tikzpicture}
\end{document}

intersections我对图书馆不太好的解决方案
\documentclass[tikz, border=1cm]{standalone}
\usetikzlibrary{intersections}
\begin{document}
\begin{tikzpicture}
        \draw [fill=gray!50] (180:1) arc (180:360:1) -- cycle;
        \draw [thick, name path = Line1] (-0.5,0) -- (0,  4);
        \draw [thick, name path = Line2] ( 0 , 4) -- (0.5,0);
        \foreach \x in {1,...,7} {
        \draw [name path=\x]  (-0.5,0.5*\x) -- (0.5,0.5*\x) ;
        \ifodd\x
            \def\lo{1}
            \def\lt{2}
            \def\lft{left}
            \def\rgt{right}
        \else
           \def\lo{2}
           \def\lt{1}
           \def\lft{right}
           \def\rgt{left}
        \fi
        \node [{\rgt}, name intersections={of={\x} and {Line\lt}, by={\x} }] at ({\x}) {{\x}};
        \node [{\lft}, name intersections={of={\x} and {Line\lo}, by={C\x} }] at ({C\x}) {{C\x}};
        }
        \draw (-0.5,0) foreach \x in {1,...,7} { -- (\x)};
        \draw (0.5,0) foreach \x in {1,...,7} { -- (C\x)};
    \end{tikzpicture}
\end{document}

答案1
除了数学解决方案之外评论中的符号 1你当然可以让 PGF/TikZ 进行计算。
如果您不需要曲折线位于一条路径上,则只需使用一个循环找到交点(intersection使用坐标系intersection of)并镜像找到的坐标来绘制另一部分。
\draw [thick] (-0.5,0) coordinate (l)
              -- (0,4) coordinate (t)
            -- (0.5,0) coordinate (r);
\foreach \i in {0,...,11}
   \draw [thin, red!\the\numexpr9*\i\relax!blue]
     (l) -- (intersection of r--t and l--{[shift=(30:1)]l})
     coordinate (r) ([xscale=-1]l) -- ([xscale=-1]r)
     (r) -- (intersection of l--t and r--{[shift=(150:1)]r})
     coordinate (l) ([xscale=-1]l) -- ([xscale=-1]r);
如果您确实想使用其他颜色作为三角形,我建议将整个\foreach块放入其中,path picture以便它被剪裁在路径上。
如果您需要一条完整路径上的每条曲折线,我们也可以这样做:
\draw (l) foreach \i in {0,...,11} {
     coordinate (l@) -- (intersection of r--t and l@--{[shift=(30:1)]  l@})
     coordinate (r@) -- (intersection of l--t and r@--{[shift=(150:1)] r@})
  };
\draw (r) foreach \i in {0,...,11} {
     coordinate (r@) -- (intersection of l--t and r@--{[shift=(150:1)] r@})
     coordinate (l@) -- (intersection of r--t and l@--{[shift=(30:1)]  l@})
  };
或者再次使用xscale = -1一堆命名坐标:
\draw [line join=bevel] (l) foreach \i in {0,...,11} {
     coordinate[alias=l@\i] (l@)
     -- (intersection of r--t and l@--{[shift=(30:1)]l@})
     coordinate[alias=r@\i] (r@)
     -- (intersection of l--t and r@--{[shift=(150:1)]r@})
  };
\draw [line join=bevel] (r) -- ([xscale=-1]r@0) foreach \i in {1,...,11} {
       -- ([xscale=-1]l@\i) -- ([xscale=-1]r@\i)
  };
但是使用该库的解决方案intersections也可以循环。
\draw [thick] (-0.5,0) coordinate[alias=l@] (l)
              -- (0,4) coordinate (t)
            -- (0.5,0) coordinate (r) [name path=ltr];

\foreach \i in {0,...,11} {
  \path [overlay, path only, name path=l@]
    ([shift=(30:\pgflinewidth)]l@) -- ++(30:2);
  \path [overlay, path only, name path=r@,
    name intersections={of=ltr and l@, by={[alias=r@\i]r@}}]
    ([shift=(150:\pgflinewidth)]r@) -- ++(150:2);
  \tikzset{name intersections={of=ltr and r@, by={[alias=l@\i]l@}}}
}

\draw (l) foreach\i in{0,...,11} { -- (r@\i) -- (l@\i) };
\draw (r) foreach\i in{0,...,11} { -- ([xscale=-1]r@\i) -- ([xscale=-1]l@\i) };
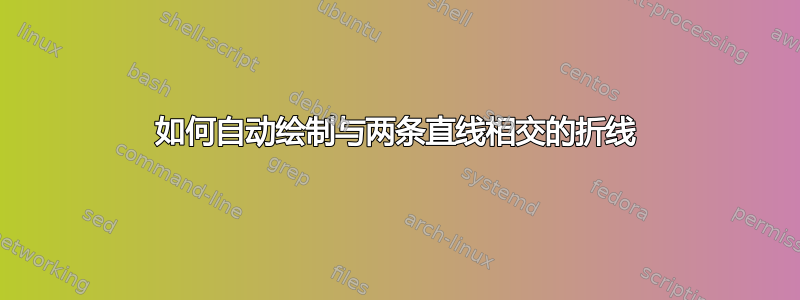
与所有其他方法一样,我们在一次迭代中计算(或绘制)之字形线和锯齿线。这样,您无需弄清楚您正在做哪一部分。
代码
\documentclass[tikz,border=1mm]{standalone}
\usetikzlibrary{intersections}
\begin{document}
\begin{tikzpicture}[
  initial drawing/.default={}{},
  initial drawing/.code 2 args={
    \draw [fill=gray!50] (180:1)
      arc [start angle=180, delta angle=180, radius=1] -- cycle;
    \draw [thick] (-0.5,0) coordinate[#1] (l)
                  -- (0,4) coordinate (t)
                -- (0.5,0) coordinate (r) [#2];}]
\matrix[row sep=5mm, column sep=5mm] {

% find and draw to intersections
% use xscale to mirror
% → separate paths
\tikzset{initial drawing}
\foreach \i in {0,...,11}
   \draw [thin, red!\the\numexpr9*\i\relax!blue]
     (l) -- (intersection of r--t and l--{[shift=(30:1)]l})
     coordinate (r) ([xscale=-1]l) -- ([xscale=-1]r)
     (r) -- (intersection of l--t and r--{[shift=(150:1)]r})
     coordinate (l) ([xscale=-1]l) -- ([xscale=-1]r);
&

% find intersections and draw
% the same for the other line
\tikzset{initial drawing}
\draw (l) foreach \i in {0,...,11} {
     coordinate (l@) -- (intersection of r--t and l@--{[shift= (30:1)] l@})
     coordinate (r@) -- (intersection of l--t and r@--{[shift=(150:1)] r@})
  };
\draw (r) foreach \i in {0,...,11} {
     coordinate (r@) -- (intersection of l--t and r@--{[shift=(150:1)] r@})
     coordinate (l@) -- (intersection of r--t and l@--{[shift= (30:1)] l@})
  };
&

% find intersections and draw
% save coordinates for xscale other line
\tikzset{initial drawing}
\draw (l) foreach \i in {0,...,11} {
     coordinate[alias=l@\i] (l@)
     -- (intersection of r--t and l@--{[shift=(30:1)]l@})
     coordinate[alias=r@\i] (r@)
     -- (intersection of l--t and r@--{[shift=(150:1)]r@})
  };
\draw (r) -- ([xscale=-1]r@0) foreach \i in {1,...,11} {
       -- ([xscale=-1]l@\i) -- ([xscale=-1]r@\i)
  };
&

% find intersections with library
% draw both lines separately
\tikzset{initial drawing={alias=l@}{name path=ltr}}
\foreach \i in {0,...,11} {
  \path [overlay, path only, name path=l@]
    ([shift=(30:\pgflinewidth)]l@) -- ++(30:2);
  \path [overlay, path only, name path=r@,
    name intersections={of=ltr and l@, by={[alias=r@\i]r@}}]
    ([shift=(150:\pgflinewidth)]r@) -- ++(150:2);
  \tikzset{name intersections={of=ltr and r@, by={[alias=l@\i]l@}}}
}

\draw (l) foreach\i in{0,...,11} { -- (r@\i) -- (l@\i) };
\draw (r) foreach\i in{0,...,11} { -- ([xscale=-1]r@\i) -- ([xscale=-1]l@\i) };
\\};
\end{tikzpicture}
\end{document}
输出
