

\documentclass{book}
\usepackage{tikz}
\usetikzlibrary{trees,positioning,fit}

\begin{document}

$$
\begin{tikzpicture}[sloped]
\node (a) at ( 0,0) [bag] {$C(0, 1)$\\\vspace{5pt}$S(0, 1)$};
\node (b1) at ( 4,1.5) [bag] {$C(\Delta t, 1)$\\\vspace{5pt}$S(\Delta t, 1)$};
\node (b2) at ( 4,-1.5) [bag] {$C(\Delta t, 2)$\\\vspace{5pt}$S(\Delta t, 2)$};
\node (c1) at ( 8,3) [bag] {$C(2\Delta t, 1)$\\\vspace{5pt}$S(2\Delta t, 1)$};
\node (c2) at ( 8,0) [bag] {$C(2\Delta t, 2)$\\\vspace{5pt}$S(2\Delta t, 2)$};
\node (c3) at ( 8,-3) [bag] {$C(2\Delta t, 3)$\\\vspace{5pt}$S(2\Delta t, 3)$};
\draw [->] (a) to node [above]{} (b1);
\draw [->] (a) to node [below]{} (b2);
\draw [->] (b1) to node [above]{} (c1);
\draw [->] (b1) to node [above]{} (c2);
\draw [->] (b2) to node [above]{} (c2);
\draw [->] (b2) to node [above]{} (c3);
\end{tikzpicture}
$$

$$
 \begin{tikzpicture}[sloped]
   \node (a) at ( 0,0) [bag] {$j\Delta S$};
   \node (b1) at ( 3,2) [bag] {$(j-1)\Delta S$};
   \node (b2) at ( 3,0) [bag]  {$j\Delta S$};
   \node (b3) at ( 3,-2) [bag] {$(j+1)\Delta S$};
   \draw [->] (a) to node [above] {$p$} (b1);
   \draw [->] (a) to node [above] {$1-p-q$} (b2);
   \draw [->] (a) to node [below] {$q$} (b3);

\end{tikzpicture}
$$

\end{document}
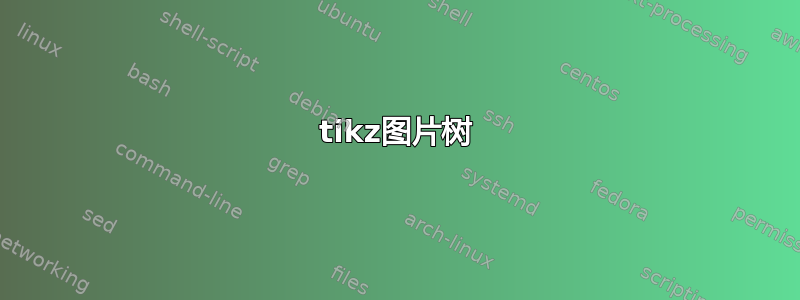
如下图所示,有三个问题:
在第一张图片中,箭头与中间的公式重叠。
为了分散公式中第一行和第二行,我使用了很幼稚的方法,
$C(\Delta t, 2)$\\\vspace{5pt}$S(\Delta t, 2)$,有什么有效的方法吗?第二张图,公式为什么
$(j-1)\Delta S$会自动变线。


答案1
解释
你的第一个问题和最后一个问题都有相同的原因: 的定义bag。你没有向我们展示确切的定义,但我猜你有类似的东西
bag/.style={text width=0.5cm}
设置text width意味着变成node具有minipage给定宽度的类似框。这反过来意味着如果节点文本变长,LaTeX 将自动添加换行符,但如果没有找到断点,您最终会得到一个溢出的框,即文本将从右侧的框中伸出。但是,节点的大小不会受到这种溢出的影响。
draw如果添加样式,你就会发现这是如何导致问题 1 和 3 的bag,在这种情况下你会得到以下结果:

(你可能也注意到了,你收到了很多水平盒溢出由此发出警告。)
可能的解决方案
第 1 点和第 3 点
bag/.style={align=left}
设置align将允许换行(\\),但节点的宽度将是最长行的长度。
要点2
\\采用可选参数来指定额外的距离,因此您可以这样做,\\[5pt]而不是更详细的\vspace。另一个选择是添加
\usepackage{setspace}到序言中,并将bag样式定义为bag/.style={align=left,font=\onehalfspacing}(或者
\doublespacing,如果\onehalfspacing还不够的话)。第三种选择是首先定义一个新的宏:
\newcommand\minimathtab[1]{%
  \renewcommand\arraystretch{1.4}% % modify 1.4 to suit your need
  \begin{tabular}{@{}>{$}l<{$}@{}}
  #1
  \end{tabular}
}
在图中,不要使用
bag样式(或者实际上任何样式),但应用该宏:\node (a) {\minimathtab{C(0, 1) \\ S(0, 1)}};
其他注意事项
不要
$$ .. $$在 LaTeX 中使用。对于未编号显示的方程式,请使用\[ ... \]。请参阅为什么 \[ ... \] 比 $$ ... $$ 更可取?不过在这种情况下,我可能只会使用一个
center环境。您已加载
positioning库,但未使用其功能。它允许将节点相对于其他节点定位,距离可以为整个图设置。这意味着您可以定位所有内容而无需使用显式坐标,并且调整间距非常容易,因为您只需调整node distance
完整代码
\documentclass{book}
\usepackage{setspace}
\usepackage{array}
\usepackage{tikz}
\usetikzlibrary{positioning}

\tikzset{bag/.style={align=left,font=\onehalfspacing}}

\newcommand\minimathtab[1]{%
  \renewcommand\arraystretch{1.2}%
   \begin{tabular}{@{}>{$}l<{$}@{}}
   #1
   \end{tabular}
}
\begin{document}

\begin{center}

\begin{tikzpicture}[
  % first value is vertical separation, second value is horizontal
  node distance=2mm and 1.5cm
]

\begin{scope}[
  % apply the bag style to all the nodes inside the scope environment
  every node/.style=bag
]
\node                     (a)  {$C(0, 1) $ \\ $ S(0, 1)$};
\node [above right=of a]  (b1) {$C(\Delta t, 1) $ \\ $ S(\Delta t, 1)$};
\node [below right=of a]  (b2) {$C(\Delta t, 2) $ \\ $ S(\Delta t, 2)$};
\node [above right=of b1] (c1) {$C(2\Delta t, 1) $ \\ $ S(2\Delta t, 1)$};
\node [below right=of b1] (c2) {$C(2\Delta t, 2) $ \\ $ S(2\Delta t, 2)$};
\node [below right=of b2] (c3) {$C(2\Delta t, 3) $ \\ $ S(2\Delta t, 3)$};
\end{scope}

\draw [->] (a) -- (b1);
\draw [->] (a) -- (b2);
\draw [->] (b1) -- (c1);
\draw [->] (b1) -- (c2);
\draw [->] (b2) -- (c2);
\draw [->] (b2) -- (c3);
\end{tikzpicture}

\begin{tikzpicture}[sloped,node distance=1cm and 2cm]
   \node (a) {$j\Delta S$};
   \node [above right=of a] (b1) {$(j-1)\Delta S$};
   \node [right=of a] (b2)  {$j\Delta S$};
   \node [below right=of a] (b3) {$(j+1)\Delta S$};

   \draw [->] (a) to node [above] {$p$}     (b1.south west);
   \draw [->] (a) to node [above] {$1-p-q$} (b2);
   \draw [->] (a) to node [below] {$q$}     (b3.north west);
\end{tikzpicture}


\begin{tikzpicture}[node distance=2mm and 1.5cm]
\node                     (a)  {\minimathtab{C(0, 1) \\ S(0, 1)}};
\node [above right=of a]  (b1) {\minimathtab{C(\Delta t, 1) \\ S(\Delta t, 1)}};
\node [below right=of a]  (b2) {\minimathtab{C(\Delta t, 2) \\ S(\Delta t, 2)}};
\node [above right=of b1] (c1) {\minimathtab{C(2\Delta t, 1) \\ S(2\Delta t, 1)}};
\node [below right=of b1] (c2) {\minimathtab{C(2\Delta t, 2) \\ S(2\Delta t, 2)}};
\node [below right=of b2] (c3) {\minimathtab{C(2\Delta t, 3) \\ S(2\Delta t, 3)}};


\draw [->] (a) -- (b1);
\draw [->] (a) -- (b2);
\draw [->] (b1) -- (c1);
\draw [->] (b1) -- (c2);
\draw [->] (b2) -- (c2);
\draw [->] (b2) -- (c3);
\end{tikzpicture}
\end{center}
\end{document}
答案2
瞧,这就是你要找的:
$$ ... $$我使用的原因有\begin{center} ... \end{center}两个:$$属于tex语法,不属于latex- 我不认为
tikzpicture在数学环境中使用图像有什么好处
我省略了样式的使用
bag。看来这是问题的根源,但其目的尚不明确。它不用于自动将节点内容分成两行,- 我删除了在节点中的线之间手动添加的垂直空间,并用以下图像样式定义替换它:
      \begin{tikzpicture}[sloped,
align = left,
 font = \linespread{1.2}\selectfont
                         ]
...
\end{tikzpicture}
- 姆韦下面还包含简单的解决方案,可以自动将较长的文本分成两行
- 第二幅图也可以画成简单的树,如下图所示姆韦以下
\documentclass{article}
\usepackage[margin=20mm]{geometry}
\usepackage{tikz}
\usetikzlibrary{trees}

\begin{document}
    \begin{center}
      \begin{tikzpicture}[sloped,
align = left,
 font = \linespread{1.2}\selectfont
                         ]
\node (a)               {$C(0,1)$\\         $S(0, 1)$};
\node (b1) at (4, 1.5)  {$C(\Delta t,1)$\\  $S(\Delta t, 1)$};
\node (b2) at (4,-1.5)  {$C(\Delta t,2)$\\  $S(\Delta t, 2)$};
\node (c1) at (8, 3.0)  {$C(2\Delta t,1)$\\ $S(2\Delta t, 1)$};
\node (c2) at (8, 0.0)  {$C(2\Delta t,2)$\\ $S(2\Delta t, 2)$};
\node (c3) at (8,-3.0)  {$C(2\Delta t,3)$\\ $S(2\Delta t, 3)$};
\draw [->]  (a)  edge (b1)
            (a)  edge (b2)
            (b1) edge (c1)
            (b1) edge (c2)
            (b2) edge (c2)
            (b2) edge (c3);
\end{tikzpicture}
    \end{center}

% first image with automatic breaking cells content into more lines
    \begin{center}
      \begin{tikzpicture}[sloped,
     align = left,
      font = \linespread{1.2}\selectfont,
text width = 9ex
                         ]
\node[align=right]  (a) {$C(0,1)$         $S(0, 1)$};
\node (b1) at (4, 1.5)  {$C(\Delta t,1)$  $S(\Delta t, 1)$};
\node (b2) at (4,-1.5)  {$C(\Delta t,2)$  $S(\Delta t, 2)$};
\node (c1) at (8, 3.0)  {$C(2\Delta t,1)$ $S(2\Delta t, 1)$};
\node (c2) at (8, 0.0)  {$C(2\Delta t,2)$ $S(2\Delta t, 2)$};
\node (c3) at (8,-3.0)  {$C(2\Delta t,3)$ $S(2\Delta t, 3)$};
\draw [->]  (a)  edge (b1)
            (a)  edge (b2)
            (b1) edge (c1)
            (b1) edge (c2)
            (b2) edge (c2)
            (b2) edge (c3);
\end{tikzpicture}
    \end{center}

    \begin{center}
 \begin{tikzpicture}[sloped,
    node distance=2cm and 3cm]
   \node (a)  at (0, 0) {$j\Delta S$};
   \node (b1) at (3, 2) {$(j-1)\Delta S$};
   \node (b2) at (3, 0) {$j\Delta S$};
   \node (b3) at (3,-2) {$(j+1)\Delta S$};
   \draw [->] (a) to node [above] {$p$} (b1.south west);
   \draw [->] (a) to node [above] {$1-p-q$} (b2.west);
   \draw [->] (a) to node [below] {$q$} (b3.north west);
\end{tikzpicture}
    \end{center}

% second image drawn as tree
    \begin{center}
\begin{tikzpicture}[sloped,
    level distance=30mm,
    sibling distance=15mm,
    grow=right,
    edge from parent/.style = {draw, semithick, ->},
    edge from parent path=
{(\tikzparentnode) -- (\tikzchildnode.west)}
                    ]
\node  {$j\Delta S$}
    child{node {$(j-1)\Delta S$}    edge from parent node[above] {$p$}}
    child{node {$j\Delta S$}        edge from parent node[above] {$1-p-q$}}
    child{node {$(j+1)\Delta S$}    edge from parent node[above] {$q$}};
\end{tikzpicture}
    \end{center}
\end{document}
