

\documentclass[english, sigconf]{acmart}
\usepackage{adjustbox,array}
\usepackage{booktabs}
\usepackage[english]{babel}
\usepackage{url}
\usepackage{amsmath}
\usepackage{fancyhdr}
\usepackage{multicol}
\usepackage{enumitem}
% Copyright
%\setcopyright{none}
\setcopyright{acmcopyright}
%\setcopyright{acmlicensed}
%\setcopyright{rightsretained}
%\setcopyright{usgov}
%\setcopyright{usgovmixed}
%\setcopyright{cagov}
%\setcopyright{cagovmixed}
\setlength{\footskip}{50pt}
\thispagestyle{fancy}
\lhead{Late-Breaking Results, Demonstration and Theory, Opinion \& Reflection Paper}
\rhead{UMAP'17, July 9-12, 2017, Bratislava, Slovakia}
\cfoot{\thepage}
\settopmatter{printacmref=false}
\setcounter{page}{83}
\acmConference[UMAP'17]{Adjunct, July 09-12}{Adjunct, July 09-12, 2017}{Bratislava, Slovakia}
\acmISBN{978-1-4503-5067-9/17/07}
\acmDOI{10.1145/3099023.3099063}
\begin{document}
\title{Certificate Achievement Unlocked: How Does MOOC Learners' Behaviour Change?}
\author{Yue Zhao, Dan Davis, Guanliang Chen, Christoph Lofi, Claudia Hauff and Geert-Jan Houben}
\orcid{}
\affiliation{%
\institution{Lambda Lab, Web Information Systems, Delft University of Technology}
\city{Delft}
\state{The Netherlands}}
\email{{y.zhao-1,d.j.davis,guanliang.chen,c.lofi,c.hauff,g.j.p.m.houben}@tudelft.nl}
\begin{abstract}
Massive Open Online Courses (MOOCs) play an ever more central role in open education. However, in contrast to traditional classroom settings, many aspects of learners' behaviour in MOOCs are not well researched. In this work, we focus on modelling learner behaviour in the context of continuous assessments with completion
certificates, the most common assessment setup in MOOCs today. Here, learners can obtain a completion certificate once they obtain a required minimal score (typically somewhere between 50 - 70\%) in tests distributed throughout the duration of a MOOC.
In this setting, the course material or tests provided after "passing" do not contribute to earning the certificate (which is ungraded), thus potentially affecting learner' behaviour. Therefore, we explore how "passing" impacts MOOC learners: \textit{do learners alter their behaviour after this point?} And if so how? While in traditional classroom-based learning the role of assessment and its influence on learning behaviour has been well-established, we are among the first to provide answers to these questions in the context of MOOCs.
\end{abstract}
\ccsdesc[500]{Information systems~Data analytics}
\ccsdesc{Information systems~\textit{Clustering}}
\ccsdesc[100]{Applied Computing~\textit{Interactive learning environments}}
\keywords{MOOCs; Learning Analytics; Certificate Achievement}
\maketitle
\thispagestyle{fancy}
\section{Introduction}
For decades, researchers in the learning sciences have explored how the assessment of learning shapes people's learning strategies and behaviours in the classroom [15, 16, 26]. One commonly encountered phenomenon, especially in higher education, is students' adaptation of their learning strategies to the specific assessment
tools: while some assessment choices such as multiple-choice questions are driving learners towards \textit{surface learning} strategies (that is, students aim to maximize recall of the material) other assessment
types including essay writing are more likely to lead to \textit{deep learning}, meaning learning that focuses on understanding [24]. Despite this knowledge, many MOOCs today rely to a large extent on a continuously distributed set of multiple choice questions for assessment, due to their inherent scalability (through auto-grading) to very large groups of learners. To illustrate this issue, we manually categorized all 46 university-level computer-science \emph{$MOOCs^1$} offered on the edX platform in October 2016 according to their assessment type as shown in Table 1: 73\% rely on multiple-choice questions conjointly with some other assessment technique, while
24\% use multiple-choice assessment exclusively without additional evaluation techniques. Only one course abstains from using any kind of multiple choice assessment.
Assessment is a concept closely related to \textit{learner effort} as learners tend to spend most of their learning efforts on course concepts that (they know) are being assessed [8, 22]. Educational researchers have long advocated for the even distribution of learner effort across
topics and course weeks [7]. Once again, MOOCs tend not to follow this guideline as shown in Table 1: most MOOCs (31 out of 46) can be passed well before the final course week; on average less than 60\% of the total score is sufficient to pass.
Classroom-based learning bears only a passing resemblance to MOOC learning for a variety of reasons including the scale, the heterogeneity of the learner group [10] with respect to age, educational and cultural background as well as the issues of isolation and remoteness that learners face [11]. It is thus an open question, whether the classroom-based findings of assessments and their influence on learning behaviours hold in MOOCs. In this work, we answer this question by empirically exploring \textit{to what extent} MOOC learners' behaviours are impacted by one particular assessment event: the \textit{course passing} event (i.e. the moment the learner accumulate sufficient scores to receive a certificate), which - depending on a MOOC's design - may potentially occur as early as half-way through the course.
Thus, we address the following research question in this work:
\begin{itemize}
\item \textbf{Do MOOC learners behave differently after clinching a passing grade?}
\end{itemize}
To this end, we analyze the log traces (our \textit{observable} events from which to infer learning behaviour) of 4, 000 MOOC learners that earn a course certificate in one of four different edX MOOCs.
Besides the scientific curiosity that underlie this question we
also believe the outcomes of this study will significantly further the discussion on MOOC course designs: Understanding and modeling learner behaviours is a prerequisite for designing MOOCs with adaptive features.\\
\footnotetext[1]{We choose this category as it is a popular on on the edX platform.}\\
\textbf{Table 1: Overview of the summative assessment type(s) and average passing threshold $\tau_{pass}$ of all 46 computer science \& programming MOOCs (in English, geared at undergraduates) open for enrolment on the edX platform on October 15, 2016. Assessment types include multiple choice (MC), fill-in-the-blank (FB), code submissions (CS), peer reviews (PR) and discussions (D). The column \#Early Passing shows the number of courses learners can pass before the final assessment is released.}\\
\noindent\adjustbox{max width=\textwidth}{%
\begin{tabular}{lrrr}\\
\hline
Assessment Type(s) & \#MOOCs & \#Early Passing & Avg. $\tau_{pass}$\\
\hline
MC+FB & 13 & 12 & 50.0\%\\
MC & 11 & 7 & 59.1\%\\
MC+FB+CS & 11 & 9 & 52.3\%\\
MC+FB+PR & 4 & 3 & 57.5\%\\
MC+FB+CS+PR & 3 & 3 & 63.3\%\\
MC+PR & 1 & 1 & 70.0\%\\
CS & 1 & 0 & 65.0\%\\
MC+CS & 1 & 1 & 50.0\%\\
MC+FB+D & 1 & 1 & 50.0\%\\
\hline
\end{tabular}}
\section{Background}
The impact of assessment on learners' learning and behaviours has long been a topic of research in the education literature [15, 16, 26]. Such studies emphasize the role of assessment as an influence on the learning process, specifically on the manner in which students elect to engage with course content. As pointed out by Gibbs and Simpson, assessment has "an overwhelming influence on what, how and how much students study" [9].
The impact of assessment on learning behaviour manifests itself in a multitude of ways. Newble and Jaeger [19] report that the changes in exam type (rote memorization-based versus application of conceptual knowledge) in a medical school led to changes in students exam preparation. The most notable change was in their choice of study location; rote memorization-based exams drove students to spend a disproportionate amount of time in the library, whereas the the concept application-focused exams led students to prepare and study in hands-on environments such as laboratories. Natriello and Dornbusch [18] found that assessments with higher standards for mastery led to students exerting more effort towards the course. Sambell and McDowell [23] report that students build their own curriculum based on their experience and the types of assessments. A case study by Cooks [4] shows that the change from fixed assessment to flexible assessment (where students could each pick their own grading scheme for the course) affects not only learners' behaviours but also their emotions in the way they approach exams.
Previous works have also found that students engage with assessed course content differently than with unassessed content (e.g., the dreaded "Will this be on the test?" question). For course content expected to be unassessed, students may be "selectively negligent" [8] or "do it in a perfunctory way" [22]. Forbes and Spence [6] examined a study which found that students stopped doing their weekly problem sheets when the teachers were too busy to grade their work. Peer-assessment was evaluated as a potential solution and led to increases in students' engagement levels and higher final exam grades than teacher-graded assessment.
Extrapolating these findings to MOOCs, we expect this behavioural change on assessed vs. unassessed content to manifest itself in a similar manner on learner engagement levels before and after passing. Once learners have reached a passing grade, no further activities are required of them to gain a certificate and thus, their activities or inactivity after passing also allow us to gain some insights into learners' motivations (extrinsic vs. intrinsic).
In the MOOC setting, Kovacs [14] studied how in-video quizzes affect learners' video-watching behaviour through observable events such as video navigation and video seeking. While this investigation enables insights into learners' short-term behavioural changes, our research differs in that we chiefly consider behaviour on a \textit{course-long scale} and how it is affected by the attainment of a passing grade.
\section{Mooc dataset}
We analyze the log traces of 4, 000 learners who successfully completed one of four MOOCs offered on the edX platform - they are summarized in Table 2. Each course is set up as an xMOOC [20] with weekly releases of lecture videos and $graded^2$ quizzes. The quizzes are composed of automatically assessed multiple choice and fill-in-the-blank questions. None of the MOOCs have a final exam. The assessment is exclusively based on the scores learners reached in the graded quizzes. In each MOOC learners can continuously check their scores by accessing their course "Progress" page.
\footnotetext[2]{Although some ungraded quizzes exist as well, we ignore them in this analysis, as only activities on graded quizzes bring learners closer to the passing threshold.}
For three of the MOOCs (FP, DA and SEW) the passing threshold
is $\tau_{pass}$ = 60\%, for SE it is $\tau_{pass}$ = 58\%. Previous work [5] has shown that learners who pass a MOOC follow the designed learning path of the course much more closely than learners who do not pass. Based on this insight we assume that the temporal sequence of course activities passers follow is in line with the design of the course.
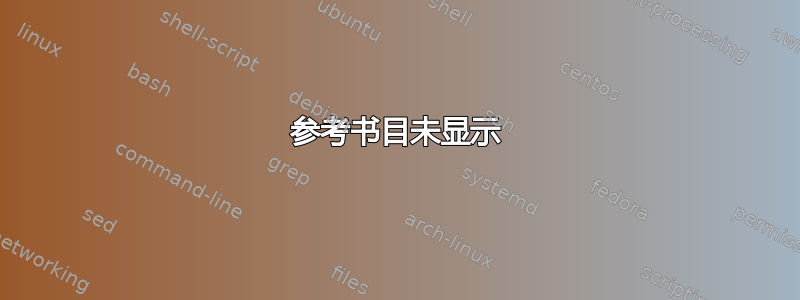
As the distribution of possible scores shows in Figure 1 (and with $\tau_{pass}$ = 58\% and $\tau_{pass}$ = 60\% in mind), all four MOOCs can be passed well before the final course unit.
\\\\
\includegraphics[width=0.5\textwidth]{obrazok11_LATEX}
\\\\
\textbf{Figure 1: Overview of the fraction of scores that learners can earn in each unit. The passing threshold for SE is $\tau_{pass}$ = 58\%, while it is $\tau_{pass}$ = 60\% for the other three MOOCs. Best viewed in color.}
\onecolumn
\textbf{Table 2: Overview of the four MOOC datasets analyzed. \#Questions refers to graded questions in MOOCs. \#Attempts refers to how many attempts a learner has for each graded question. Engaged refers to learners who watched at least one lecture video or answered one question. Compl Rate refers to the completion rate of a MOOC.}\\
\renewcommand{\arraystretch}{1.5}
\noindent\adjustbox{max width=\textwidth}{%
\begin{tabular}{llllrrrrrrrr}\\
\hline
& & & & & & & & & \textbf{\#Learners} & \\\cline{9-11}
\textbf{ID} & \textbf{Name} & \textbf{Start} & \textbf{End} & \textbf{\#Units} & \textbf{\#Videos} & \textbf{\#Questions} & \textbf{\#Attempts} & \textbf{Registered} & \textbf{Engaged} & \textbf{Passed} & \textbf{Compl Rate}\\
\hline
FP & \textit{Introduction to Functional Programming} & 10/2015 & 01/2016 & 8 & 39 & 285 & 1 & 25, 188 & 9, 900 & 1, 143 & 4.54\%\\
\hline
DA & \textit{Data Analysis: Take It to the MAX()} & 09/2015 & 11/2015 & 8 & 60 & 137 & 2 & 23, 813 & 9, 780 & 1, 156 & 4.85\%\\
\hline
SEW & \textit{Treatment of Urban Sewage} & 04/2016 & 06/2016 & 7 & 79 & 36 & 1 & 11, 006 & 2, 589 & 361 & 3.28\%\\
\hline
SE & \textit{Solar Energy} & 09/2015 & 12/2015 & 8 & 61 & 128 & 1 - 3 & 26, 718 & 12, 723 & 1, 346 & 5.04\%\\
\hline
\end{tabular}}
\begin{multicols}{2}
\hskip-0.4cm\includegraphics[width=0.47\textwidth]{obrazok22_LATEX}\\\\
\textbf{Figure 2: Total number of certificate earners (i.e. "passers") at the end of each unit.}\\
In Figure 2 we plot the total number of learners who earned a certificate by the end of each (weekly) unit - starting at the first possible certificate-earning unit. We make two key observations from this sample of courses: (1) many learners earn the certificate at the earliest opportunity - for both FP and SEW this is true for approximately 60\% of the learners, for DA and SE it holds for 40\% and 30\% of the learners respectively; (2) only a very small minority of learners pass in the final two units.
\section{Methodology}
In this section, we first formally define the core concepts which we will use throughout our work and then describe how we conduct the analyses to answer our research question.
\subsection{Concept Definitions}
\textbf{MOOCs \& MOOC units} A MOOC \textit{M} consists of a sequence of m
units, i.e. \textit{M} = ($U_1$,$U_2$, ...,$U_m$ ). Each unit contains videos and/or
quizzes and is typically designed to be completed over the course
of one calendar week.\\
\textbf{Unit-n quizzes \& videos} According to [1, 13], there are two core
components of xMOOCs: (1) lecture videos, and (2) quizzes.
Quizzes and lecture videos included in a weekly unit $U_i$ are
represented as $U_i$ = \{$V_i$, $Q_i$\}.\\
\textbf{Learner's Activities} We consider quiz scores and time spent on
videos as the main measurements for learner activity on a MOOC
platform. The quiz scores in $U_i$ are normalized by the maximum
scores of $Q_i$. The time spent in $U_i$ is normalized by the full video
length of $V_i$.\\
\textbf{Passers} Passers \textit{P} are learners who are eligible to receive a MOOC
certificate at the end of the MOOC as their assessment scores
reach the defined threshold $\tau_{pass}$ (independent of the unit they
reach the threshold). In the present research, only these learners
are considered.\\
\textbf{Unit-n passers} Given $\tau_{pass}$, unit-n passers $P_n$ are those passers
whose achieved assessment scores reach at least $\tau_{pass}$ only con-
sidering units up to $U_n$ and whose scores up to unit $U_{n-1}$ are not
sufficient, i.e. $P_n$ =\(\{p\in P|\sum_{i=1}^{n-1}Q_{i}^{p}<\tau_{pass}\land\sum_{i=1}^{n}Q_{i}^{p}\ge\tau_{pass}\}\)
Note once more that the actual time the quizzes are completed
by the passers can vary (a quiz released in unit n may be com-
pleted a week or two after its initial release). This, however, has
little impact on our work as passers usually follow the predefined
sequences of MOOC units [5].\\
\textbf{Pre-passing activities} The pre-passing activities of a passer \(p\in\)
$P_n$ include all quiz \& video activities up to \& including unit \textit{n}.\\
\textbf{Post-passing activities} The post-passing activities of a passer
\(p\in P\) include all quiz and video activities starting in unit \textit{n} + 1.
A passer who passes in the final unit has no post-passing activity.\\
We denote the previously introduced concepts with the respective MOOC label when appropriate, e.g. $P_{5,DA}$ or $P_{6,FP}$ for referring to a specific passer group.
\subsection{From Concepts to Analyses}
Recall that in a traditional classroom setting learners engage differently with assessed course content than they do with unassessed content [6, 8, 12, 22]. Applying this concept to the MOOC context, we expect to observe a difference in the way learners behave before and after reaching a passing grade.
To address our research question, we operationalize behaviour in this case as a learner's engagement with course quizzes and videos - the two most prominent activities in most MOOC settings [3, 25]. We then identify the unit in which each learner first reached a passing grade and then group learners accordingly. Finally, we plot the distribution of their quiz scores and video watching activities over time.
In the next step, we zoom in and explore the individual learner behaviour. In order to determine whether behavioural changes can be observed on individual learners, we represent each passer \textit{p} by a vector of her normalized quiz scores. Then, we resort to k-means clustering (also employed in [2, 13] to analyze learners' activities) of all generated vectors in each unit-n passer group. We measure the distance between learner feature vectors by their Euclidean $distance^3$. As we do not know in advance how many different prototypical learner behaviours exist (i.e., the best number of clusters is unknown), we generate multiple k-means clusterings with \textit{k} = [1, 2, . . . , 7]. For each of these seven clusterings, we assess the clustering quality using silhouette coeficients [21], an effective technique for assessing the quality of a clustering result. Our final clustering is the one with the highest silhouette score.
\section{Results}
\subsection{Observation Analysis}
The distribution of quiz scores and video consumption for our learners grouped by passing unit are shown in Figure 3 and Figure $4^4$. Here, each row shows the behaviour of one group of passers (e.g.
the top row in Figure 3a shows the quiz scoring activities of all $P_{5,FP}$ learners) while each column shows the behaviour of all passers in a particular unit (e.g. the last column of Figure 3a shows the behaviour of all passers in $U_8$).
Across all courses we find learners who pass in early units (top two rows in each sub-figure of Figure 3) to score in a narrow range of high scores before passing - this is of course a rerequisite for passing early. After the minimum passing threshold is reached, however, the variance of scores increases drastically, with a number of learners starting to score very low. For example, 6\% of $P_{5,FP}$ learners (i.e. learners who passed in $U_5$) score less than 20\% of the available points in $Q_6$ and 22\% of $P_{6,FP}$ learners (who passed in week 6) score less than 20\% of the available points in $Q_7$. In contrast to DA (and SEW - not shown here), in FP (and SE) we observe a larger number of learners who maintain high scores after passing than learners who score low after passing. Concretely for FP, in the final unit $U_8$, more than two thirds of the $P_{5,FP}$ passers score 80\% or higher on the remaining quizzes.
The video consumption behaviour of passers across MOOCs is also noteworthy: in every MOOC a small to medium fraction of passers does not watch $any^5$ of the unit's videos -3.4\% in FP, 3.0\% in DA, 10.8\% in SEW and 20.0\% in SE. In Figure 4, we report on the video watching behaviour of all those passers with at least one video activity in our logs. Across the four courses the trend over time is similar: the number of passers who do not watch lecture videos increases in the final units. With respect to the completeness of lecture video consumption we find a clear divide between DA (\& SE - not shown here) and SEW \& FP: in DA \& SE learners' normalized video consumption peaks around 1.0 (indicating that many learners watch the whole video lecture at normal speed), while in SEW \& FP for most passers the normalized duration is below 1.0 indicating that they skip at least parts of the videos.
\footnotetext[3]{We also explored Dynamic Time Warping [27], a specialized distance function for
time-series data - this did not yield a higher silhouette score.}
\footnotetext[4]{Due to space limitations, we only present graphs for a subset of our data. For all
analyses conducted in this paper, the full results can be found at https://yue-zhao.github.io/umap2017/}
\footnotetext[5]{We note that an alternative explanation for the zero peak may be that learners
download videos for offine learning as suggested by [1], which is not captured in the
edX logs. While this may be true for some learners, this cannot explain the change in
behaviour after the passing threshold is reached.}
We can conclude that learner behaviours on quizzes are distinctive before and after passing. We also find (not unexpectedly) marked differences between the quizzing behaviour of passers and not-yet-passers in the same unit. At the same time, we fail to observe the same clear differences in video consumption. Based on this result, in our subsequent analysis we consider only passers' quiz behaviours.
\subsection{Clustering Analysis}
Based on the clustering described in Section 4.2 we visualize the resulting normalized quiz score clusters in Figure 5 for the four courses: each unit in each cluster is represented by the average score learners in that cluster achieve in that unit with their respective confidence bands. The key insights of Figure 5 are:
\begin{itemize}[leftmargin=0pt]
\item For passers who pass MOOCs early (i.e. the first two unit-n passers groups), the clusters share very similar activity levels before passing, but begin to differ immediately at the passing unit.
\item For nearly all unit-n passer groups and MOOCs, choosing \textit{k} = 2 clusters yields the best clustering fit. This strongly indicates that for early passers, there are two dominant behaviour patterns: "reducing scores" (rapidly declining quiz scores for the units following the passing event) and "keeping scores" (the averaged scores of passers in one cluster stay more or less stable at a high level) after passing.
\item There are exceptions to the two-cluster rule: $P_{5,SE}$ and $P_{7,SE}$ split into many small clusters. The latter can be attributed to the overall low number of learners to be clustered. The five clusters observed in $P_{5,SE}$ are explained by the special setup of SE with "exams" appearing in $U_3$, $U_6$ and $U_8$ which not only cover the material of the current unit but also of previous units. $P_{5,SE}$ fall into different clusters depending on whether or not they "take the exams" in $U_6$ and $U_8$.
\item The MOOCs differ in the dominant post-passing behaviour, while for $P_{5,FP}$ and $P_{6,SE}$ the dominant cluster is "keeping scores", in DA across all groups the "reducing scores" passers dominate over those that keep participating in the assessment (not shown here). This may hint at different motivations for taking the course (gaining knowledge vs. gaining a certificate).
\item In $P_{7,DA}$ we also observe a behaviour unique to DA: a group of learners starting off slowly (low scores in $U_1$ and $U_2$) and finishing strong (high scores in starting in $U_3$).
\end{itemize}
These results show that indeed, we find significant changes in learner behaviour after the passing event. We conducted a similar analysis for video consumption, but as expected based on the observation analysis, we did not find meaningful clusters or behavioural changes after passing.
\section{CONCLUSIONS}
In this work, we have investigated the impact of the passing-scoreachieved event on MOOC learners' behaviours. In our analyses across four thousand learners in four MOOCs) of learners' activities before and after passing we found the vast majority of passers to pass at the earliest possible point; after passing learners exhibit a certain typology of post-passing behaviours which may be indicative of their motivation (extrinsic vs. intrinsic) for taking the course.
\end{multicols}
\includegraphics[width=0.93\textwidth]{obrazok3_LATEX}\\
\textbf{Figure 3: Quiz score distribution: passers are binned according to their passing unit. Rows represent groups of passers, columns represent one particular unit. Red plots show groups of passers that reached the passing threshold in a previous unit.}\\
\includegraphics[width=0.93\textwidth]{obrazok4_LATEX}\\
\textbf{Figure 4: Video consumption distribution: passers are binned according to their passing unit. Rows represent groups of passers, columns represent a particular unit. Red plots show groups of passers that reached the passing threshold in a previous unit.}
\begin{multicols}{2}
We also found a subset of learners to heavily reduce their engagement with quiz questions and lecture videos after reaching the point of passing. If we consider this observation in the context of the value or significance of a course certificate, we have a set of learners who have earned a certificate (and can therefore claim mastery of the course subject) but who have only been exposed to 60\% of the course materials. Now that universities are beginning to offer official college credits for completing a MOOC [17], this highlights the need for course practitioners to design assessment systems which require learners to display mastery of an entire course's subjects before earning a certificate.
To our knowledge, this analysis has been the first to specifically focus on the event of passing and the impact of this event on MOOC learners' behaviours. This is a first step towards gaining more detailed and fine-grained insights into learners' behaviours and motivation. Future work will expand this exploratory research to a larger number of MOOCs (from different fields, requiring different types of background knowledge) and take learners' demographic information, prior knowledge and motivations into account (do learners of a certain demographic slow down after passing more than others?). Based on these insights, we aim to create MOOCs that provide a more tailored and sustained learning experience to MOOC learners than what is common today.
\end{multicols}
\bibliography{bib1}
\bibliographystyle{plainnat}
\end{document}
和 bib1 文件
@inproceedings{anderson2014engaging,
    author = {Anderson, Ashton and Huttenlocher, Daniel and Kleinberg, Jon and Leskovec, Jure},
    booktitle = {Proceedings of the 23rd international conference on World wide web},
    citeulike-article-id = {14458171},
    organization = {ACM},
    pages = {687--698},
    posted-at = {2017-10-14 10:19:59},
    priority = {2},
    title = {Engaging with massive online courses},
    year = {2014}
}
答案1
你的代码中有很多错误。让我们开始消除它们……
请参阅以下 MWE(重要的代码更改以 标记<======):
\RequirePackage{filecontents}
\begin{filecontents}{\jobname.bib}
@inproceedings{anderson2014engaging,
    author = {Anderson, Ashton and Huttenlocher, Daniel and Kleinberg, Jon and Leskovec, Jure},
    booktitle = {Proceedings of the 23rd international conference on World wide web},
    citeulike-article-id = {14458171},
    organization = {ACM},
    pages = {687--698},
    posted-at = {2017-10-14 10:19:59},
    priority = {2},
    title = {Engaging with massive online courses},
    year = {2014}
}
@Book{Goossens,
  author    = {Goossens, Michel and Mittelbach, Frank and
               Samarin, Alexander},
  title     = {The LaTeX Companion},
  edition   = {1},
  publisher = {Addison-Wesley},
  location  = {Reading, Mass.},
  year      = {1994},
}
@Book{adams,
  title     = {The Restaurant at the End of the Universe},
  author    = {Douglas Adams},
  series    = {The Hitchhiker's Guide to the Galaxy},
  publisher = {Pan Macmillan},
  year      = {1980},
}
\end{filecontents}


\documentclass[english, sigconf]{acmart}

\usepackage{adjustbox,array}
\usepackage{booktabs}
\usepackage[english]{babel}
\usepackage{url}
\usepackage{amsmath}
\usepackage{fancyhdr}
\usepackage{multicol}
\usepackage{enumitem}
\usepackage{caption}

% Copyright
%\setcopyright{none}
\setcopyright{acmcopyright}
%\setcopyright{acmlicensed}
%\setcopyright{rightsretained}
%\setcopyright{usgov}
%\setcopyright{usgovmixed}
%\setcopyright{cagov}
%\setcopyright{cagovmixed}
\setlength{\footskip}{50pt}

\thispagestyle{fancy}
\lhead{Late-Breaking Results, Demonstration and Theory, Opinion \& Reflection Paper}
\rhead{UMAP'17, July 9-12, 2017, Bratislava, Slovakia}
\cfoot{\thepage}
\settopmatter{printacmref=false}
\setcounter{page}{83}

\acmConference[UMAP'17]{Adjunct, July 09-12}{Adjunct, July 09-12, 2017}{Bratislava, Slovakia}
\acmISBN{978-1-4503-5067-9/17/07}

\acmDOI{10.1145/3099023.3099063}

\begin{document}
\title{Certificate Achievement Unlocked: How Does MOOC Learners' Behaviour Change?}

\author{Yue Zhao, Dan Davis, Guanliang Chen, Christoph Lofi, Claudia Hauff and Geert-Jan Houben}
\orcid{}
\affiliation{%
  \institution{Lambda Lab, Web Information Systems, Delft University of Technology}
  \city{Delft}
  \state{The Netherlands}}
\email{{y.zhao-1,d.j.davis,guanliang.chen,c.lofi,c.hauff,g.j.p.m.houben}@tudelft.nl}

\begin{abstract}
Massive Open Online Courses (MOOCs) play an ever more central role in open education.
\end{abstract}

\ccsdesc[500]{Information systems~Data analytics}
\ccsdesc{Information systems~\textit{Clustering}}
\ccsdesc[100]{Applied Computing~\textit{Interactive learning environments}}

\keywords{MOOCs; Learning Analytics; Certificate Achievement}

\maketitle
\thispagestyle{fancy}

\section{Introduction}
For decades, researchers in the learning sciences have explored how the
assessment of learning shapes people's learning strategies and behaviours
in the classroom \cite{anderson2014engaging,Goossens,adams}. % <==============
One commonly encountered phenomenon, especially in higher education, is
students' adaptation of their learning strategies to the specific
assessment tools: while some assessment choices such as multiple-choice
questions are driving learners towards \textit{surface learning}
strategies (that is, students aim to maximize recall of the material)
other assessment types including essay writing are more likely to lead
to \textit{deep learning}, meaning learning that focuses on
understanding [24]. Despite this knowledge, many MOOCs today rely to a
large extent on a continuously distributed set of multiple choice
questions for assessment, due to their inherent scalability (through
auto-grading) to very large groups of learners. To illustrate this
issue, we manually categorized all 46 university-level computer-science
\emph{MOOCs}\footnote{We choose this category as it is a popular on on the edX platform.} % <==================
offered on the edX platform in October 2016 according
to their assessment type as shown in
Table~\ref{tab:overwiew}: 73\% rely on % <==============================
multiple-choice questions conjointly with some other assessment
technique, while 24\% use multiple-choice assessment exclusively
without additional evaluation techniques. Only one course abstains from
using any kind of multiple choice assessment.

...
Besides the scientific curiosity that underlie this question we
also believe the outcomes of this study will significantly further the discussion on MOOC course designs: Understanding and modeling learner behaviours is a prerequisite for designing MOOCs with adaptive features.
%\noindent\adjustbox{max width=\textwidth}{%
\begin{table}
\caption{Overview of the summative assessment type(s) and average passing threshold $\tau_{pass}$ of all 46 computer science \& programming MOOCs (in English, geared at undergraduates) open for enrolment on the edX platform on October 15, 2016. Assessment types include multiple choice (MC), fill-in-the-blank (FB), code submissions (CS), peer reviews (PR) and discussions (D). The column \#Early Passing shows the number of courses learners can pass before the final assessment is released.}\label{tab:overwiew}
\begin{tabular}{lrrr}\\
\hline
Assessment Type(s) &  \#MOOCs &  \#Early Passing & Avg. $\tau_{pass}$\\
\hline
MC+FB & 13 & 12 & 50.0\%\\
MC & 11 & 7 & 59.1\%\\
MC+FB+CS & 11 & 9 & 52.3\%\\
MC+FB+PR & 4 & 3 & 57.5\%\\
MC+FB+CS+PR & 3 & 3 & 63.3\%\\
MC+PR & 1 & 1 & 70.0\%\\
CS & 1 & 0 & 65.0\%\\
MC+CS & 1 & 1 & 50.0\%\\
MC+FB+D & 1 & 1 & 50.0\%\\
\hline
\end{tabular}%}
\end{table}

\section{Background}
The impact of assessment on learners' learning and behaviours has long been a topic of research in the education literature [15, 16, 26]. Such studies emphasize the role of assessment as an influence on the learning process, specifically on the manner in which students elect to engage with course content. As pointed out by Gibbs and Simpson, assessment has "an overwhelming influence on what, how and how much students study" [9].

...

As the distribution of possible scores shows in Figure 1 (and with $\tau_{pass}$ = 58\% and $\tau_{pass}$ = 60\% in mind), all four MOOCs can be passed well before the final course unit.

\begin{figure}
\includegraphics[width=\linewidth]{example-image-a}%obrazok11_LATEX
\caption{Overview of the fraction of scores that learners can earn in each unit. The passing threshold for SE is $\tau_{pass}$ = 58\%, while it is $\tau_{pass}$ = 60\% for the other three MOOCs. Best viewed in color.}
\end{figure}


\begin{table*}
\renewcommand{\arraystretch}{1.5}
\caption{Overview of the four MOOC datasets analyzed. \#Questions refers to graded questions in MOOCs. \#Attempts refers to how many attempts a learner has for each graded question. Engaged refers to learners who watched at least one lecture video or answered one question. Compl Rate refers to the completion rate of a MOOC.}
\noindent\adjustbox{max width=\textwidth}{%
\begin{tabular}{llllrrrrrrrr}\\
\hline
 & & & & & & & & & \textbf{\#Learners} & \\\cline{9-11}
\textbf{ID} & \textbf{Name} & \textbf{Start} & \textbf{End} & \textbf{\#Units} & \textbf{\#Videos} & \textbf{\#Questions} & \textbf{\#Attempts} & \textbf{Registered} & \textbf{Engaged} & \textbf{Passed} & \textbf{Compl Rate}\\
\hline
FP & \textit{Introduction to Functional Programming} & 10/2015 & 01/2016 & 8 & 39 & 285 & 1 & 25, 188 & 9, 900 & 1, 143 & 4.54\%\\
\hline
DA & \textit{Data Analysis: Take It to the MAX()} & 09/2015 & 11/2015 & 8 & 60 & 137 & 2 & 23, 813 & 9, 780 & 1, 156 & 4.85\%\\
\hline
SEW & \textit{Treatment of Urban Sewage} & 04/2016 & 06/2016 & 7 & 79 & 36 & 1 & 11, 006 & 2, 589 & 361 & 3.28\%\\
\hline
SE & \textit{Solar Energy} & 09/2015 & 12/2015 & 8 & 61 & 128 & 1 - 3 & 26, 718 & 12, 723 & 1, 346 & 5.04\%\\
\hline
\end{tabular}%
}
\end{table*}

\begin{figure}
\includegraphics[width=\linewidth]{example-image-b}
\caption{Total number of certificate earners (i.e. "passers") at the end of each unit.}\label{fig:earner}
\end{figure}

In Figure~\ref{fig:earner} we plot the total number of learners who earned a certificate by the end of each (weekly) unit - starting at the first possible certificate-earning unit. We make two key observations from this sample of courses: (1) many learners earn the certificate at the earliest opportunity - for both FP and SEW this is true for approximately 60\% of the learners, for DA and SE it holds for 40\% and 30\% of the learners respectively; (2) only a very small minority of learners pass in the final two units.

\section{Methodology}
In this section, we first formally define the core concepts which we will use throughout our work and then describe how we conduct the analyses to answer our research question.
\subsection{Concept Definitions}
\textbf{MOOCs \& MOOC units} A MOOC \textit{M} consists of a sequence of m

units, i.e. \textit{M} = ($U_1$,$U_2$, ...,$U_m$ ). Each unit contains videos and/or

quizzes and is typically designed to be completed over the course

of one calendar week.\\
\textbf{Unit-n quizzes \& videos} According to [1, 13], there are two core

components of xMOOCs: (1) lecture videos, and (2) quizzes.

Quizzes and lecture videos included in a weekly unit $U_i$ are

represented as $U_i$ = \{$V_i$, $Q_i$\}.\\
\textbf{Learner's Activities} We consider quiz scores and time spent on

videos as the main measurements for learner activity on a MOOC

platform. The quiz scores in $U_i$ are normalized by the maximum

scores of $Q_i$. The time spent in $U_i$ is normalized by the full video

length of $V_i$.\\
\textbf{Passers} Passers \textit{P} are learners who are eligible to receive a MOOC

certificate at the end of the MOOC as their assessment scores

reach the defined threshold $\tau_{pass}$ (independent of the unit they

reach the threshold). In the present research, only these learners

are considered.\\
\textbf{Unit-n passers} Given $\tau_{pass}$, unit-n passers $P_n$ are those passers

whose achieved assessment scores reach at least $\tau_{pass}$ only con-

sidering units up to $U_n$ and whose scores up to unit $U_{n-1}$ are not

sufficient, i.e. $P_n$ =\(\{p\in P|\sum_{i=1}^{n-1}Q_{i}^{p}<\tau_{pass}\land\sum_{i=1}^{n}Q_{i}^{p}\ge\tau_{pass}\}\)

Note once more that the actual time the quizzes are completed

by the passers can vary (a quiz released in unit n may be com-

pleted a week or two after its initial release). This, however, has

little impact on our work as passers usually follow the predefined

sequences of MOOC units [5].\\
\textbf{Pre-passing activities} The pre-passing activities of a passer \(p\in\)

$P_n$ include all quiz \& video activities up to \& including unit \textit{n}.\\
\textbf{Post-passing activities} The post-passing activities of a passer

\(p\in P\) include all quiz and video activities starting in unit \textit{n} + 1.

A passer who passes in the final unit has no post-passing activity.\\

We denote the previously introduced concepts with the respective MOOC label when appropriate, e.g. $P_{5,DA}$ or $P_{6,FP}$ for referring to a specific passer group.
\subsection{From Concepts to Analyses}
Recall that in a traditional classroom setting learners engage differently with assessed course content than they do with unassessed content [6, 8, 12, 22]. Applying this concept to the MOOC context, we expect to observe a difference in the way learners behave before and after reaching a passing grade.

To address our research question, we operationalize behaviour in this case as a learner's engagement with course quizzes and videos - the two most prominent activities in most MOOC settings [3, 25]. We then identify the unit in which each learner first reached a passing grade and then group learners accordingly. Finally, we plot the distribution of their quiz scores and video watching activities over time.

In the next step, we zoom in and explore the individual learner behaviour. In order to determine whether behavioural changes can be observed on individual learners, we represent each passer \textit{p} by a vector of her normalized quiz scores. Then, we resort to k-means clustering (also employed in [2, 13] to analyze learners' activities) of all generated vectors in each unit-n passer group. We measure the distance between learner feature vectors by their Euclidean $distance^3$. As we do not know in advance how many different prototypical learner behaviours exist (i.e., the best number of clusters is unknown), we generate multiple k-means clusterings with \textit{k} = [1, 2, . . . , 7]. For each of these seven clusterings, we assess the clustering quality using silhouette coeficients [21], an effective technique for assessing the quality of a clustering result. Our final clustering is the one with the highest silhouette score.

\section{Results}
\subsection{Observation Analysis}
The distribution of quiz scores and video consumption for our learners grouped by passing unit are shown in Figure~\ref{fig:score} and Figure~\ref{fig:video}\footnote{Due to space limitations, we only present graphs for a subset of our data. For all
analyses conducted in this paper, the full results can be found at https://yue-zhao.github.io/umap2017/}. % <=======================
Here, each row shows the behaviour of one group of passers (e.g.
the top row in Figure 3a shows the quiz scoring activities of all $P_{5,FP}$ learners) while each column shows the behaviour of all passers in a particular unit (e.g. the last column of Figure 3a shows the behaviour of all passers in $U_8$).

Across all courses we find learners who pass in early units (top two rows in each sub-figure of Figure 3) to score in a narrow range of high scores before passing - this is of course a rerequisite for passing early. After the minimum passing threshold is reached, however, the variance of scores increases drastically, with a number of learners starting to score very low. For example, 6\% of $P_{5,FP}$ learners (i.e. learners who passed in $U_5$) score less than 20\% of the available points in $Q_6$ and 22\% of $P_{6,FP}$ learners (who passed in week 6) score less than 20\% of the available points in  $Q_7$. In contrast to DA (and SEW - not shown here), in FP (and SE) we observe a larger number of learners who maintain high scores after passing than learners who score low after passing. Concretely for FP, in the final unit $U_8$, more than two thirds of the $P_{5,FP}$ passers score 80\% or higher on the remaining quizzes.

The video consumption behaviour of passers across MOOCs is also noteworthy: in every MOOC a small to medium fraction of passers does not watch $any^5$ of the unit's videos -3.4\% in FP, 3.0\% in DA, 10.8\% in SEW and 20.0\% in SE. In Figure 4, we report on the video watching behaviour of all those passers with at least one video activity in our logs. Across the four courses the trend over time is similar: the number of passers who do not watch lecture videos increases in the final units. With respect to the completeness of lecture video consumption we find a clear divide between DA (\& SE - not shown here) and SEW \& FP: in DA \& SE learners' normalized video consumption peaks around 1.0 (indicating that many learners watch the whole video lecture at normal speed), while in SEW \& FP for most passers the normalized duration is below 1.0 indicating that they skip at least parts of the videos.

\footnotetext[3]{We also explored Dynamic Time Warping [27], a specialized distance function for
time-series data - this did not yield a higher silhouette score.}
%\footnotetext[4]{}
\footnotetext[5]{We note that an alternative explanation for the zero peak may be that learners
download videos for offine learning as suggested by [1], which is not captured in the
edX logs. While this may be true for some learners, this cannot explain the change in
behaviour after the passing threshold is reached.}

We can conclude that learner behaviours on quizzes are distinctive before and after passing. We also find (not unexpectedly) marked differences between the quizzing behaviour of passers and not-yet-passers in the same unit. At the same time, we fail to observe the same clear differences in video consumption. Based on this result, in our subsequent analysis we consider only passers' quiz behaviours.

\subsection{Clustering Analysis}
Based on the clustering described in Section 4.2 we visualize the resulting normalized quiz score clusters in Figure 5 for the four courses: each unit in each cluster is represented by the average score learners in that cluster achieve in that unit with their respective confidence bands. The key insights of Figure 5 are:

\begin{itemize}[leftmargin=0pt]
\item For passers who pass MOOCs early (i.e. the first two unit-n passers groups), the clusters share very similar activity levels before passing, but begin to differ immediately at the passing unit.
\item For nearly all unit-n passer groups and MOOCs, choosing \textit{k} = 2 clusters yields the best clustering fit. This strongly indicates that for early passers, there are two dominant behaviour patterns: "reducing scores" (rapidly declining quiz scores for the units following the passing event) and "keeping scores" (the averaged scores of passers in one cluster stay more or less stable at a high level) after passing.
\item There are exceptions to the two-cluster rule: $P_{5,SE}$ and $P_{7,SE}$ split into many small clusters. The latter can be attributed to the overall low number of learners to be clustered. The five clusters observed in $P_{5,SE}$ are explained by the special setup of SE with "exams" appearing in $U_3$, $U_6$ and $U_8$ which not only cover the material of the current unit but also of previous units. $P_{5,SE}$ fall into different clusters depending on whether or not they "take the exams" in $U_6$ and $U_8$.
\item The MOOCs differ in the dominant post-passing behaviour, while for $P_{5,FP}$ and $P_{6,SE}$ the dominant cluster is "keeping scores", in DA across all groups the "reducing scores" passers dominate over those that keep participating in the assessment (not shown here). This may hint at different motivations for taking the course (gaining knowledge vs. gaining a certificate).
\item In $P_{7,DA}$ we also observe a behaviour unique to DA: a group of learners starting off slowly (low scores in $U_1$ and $U_2$) and finishing strong (high scores in starting in $U_3$).
\end{itemize}

These results show that indeed, we find significant changes in learner behaviour after the passing event. We conducted a similar analysis for video consumption, but as expected based on the observation analysis, we did not find meaningful clusters or behavioural changes after passing.
\section{CONCLUSIONS}
In this work, we have investigated the impact of the passing-scoreachieved event on MOOC learners' behaviours. In our analyses across four thousand learners in four MOOCs) of learners' activities before and after passing we found the vast majority of passers to pass at the earliest possible point; after passing learners exhibit a certain typology of post-passing behaviours which may be indicative of their motivation (extrinsic vs. intrinsic) for taking the course.

\begin{figure*}
\includegraphics[width=0.93\textwidth]{example-image-a}
\caption{Quiz score distribution: passers are binned according to their passing unit. Rows represent groups of passers, columns represent one particular unit. Red plots show groups of passers that reached the passing threshold in a previous unit.}\label{fig:score}
\end{figure*}

\begin{figure*}
\includegraphics[width=0.93\textwidth]{example-image-b}
\caption{Video consumption distribution: passers are binned according to their passing unit. Rows represent groups of passers, columns represent a particular unit. Red plots show groups of passers that reached the passing threshold in a previous unit.}\label{fig:video}
\end{figure*}

%\begin{multicols}{2}
We also found a subset of learners to heavily reduce their engagement with quiz questions and lecture videos after reaching the point of passing. If we consider this observation in the context of the value or significance of a course certificate, we have a set of learners who have earned a certificate (and can therefore claim mastery of the course subject) but who have only been exposed to 60\% of the course materials. Now that universities are beginning to offer official college credits for completing a MOOC [17], this highlights the need for course practitioners to design assessment systems which require learners to display mastery of an entire course's subjects before earning a certificate.

To our knowledge, this analysis has been the first to specifically focus on the event of passing and the impact of this event on MOOC learners' behaviours. This is a first step towards gaining more detailed and fine-grained insights into learners' behaviours and motivation. Future work will expand this exploratory research to a larger number of MOOCs (from different fields, requiring different types of background knowledge) and take learners' demographic information, prior knowledge and motivations into account (do learners of a certain demographic slow down after passing more than others?). Based on these insights, we aim to create MOOCs that provide a more tailored and sustained learning experience to MOOC learners than what is common today.
%\end{multicols}

\bibliographystyle{plainnat}
\bibliography{\jobname}

\end{document}
我们从没有插入的书目开始。在你的代码中你有
in the classroom [15, 16, 26]
15是指 bib 条目的编号等。在 LaTeX 中,你可以使用\cite如下命令:
in the classroom \cite{anderson2014engaging,Goossens,adams}. % <==============
[...]更改您的代码中的所有内容以供使用\cite{...}!
使用\label{}和\ref{}自动引用表格和图形,例如:
Table~\ref{tab:overwiew}: 73\% rely on % <==============================
与相应的表定义
\begin{table}
\caption{Overview of the summative assessment type(s) and average passing threshold $\tau_{pass}$ of all 46 computer science \& programming MOOCs (in English, geared at undergraduates) open for enrolment on the edX platform on October 15, 2016. Assessment types include multiple choice (MC), fill-in-the-blank (FB), code submissions (CS), peer reviews (PR) and discussions (D). The column \#Early Passing shows the number of courses learners can pass before the final assessment is released.}\label{tab:overwiew}
\begin{tabular}{lrrr}\\
\hline
Assessment Type(s) &  \#MOOCs &  \#Early Passing & Avg. $\tau_{pass}$\\
\hline
MC+FB & 13 & 12 & 50.0\%\\
MC & 11 & 7 & 59.1\%\\
MC+FB+CS & 11 & 9 & 52.3\%\\
MC+FB+PR & 4 & 3 & 57.5\%\\
MC+FB+CS+PR & 3 & 3 & 63.3\%\\
MC+PR & 1 & 1 & 70.0\%\\
CS & 1 & 0 & 65.0\%\\
MC+CS & 1 & 1 & 50.0\%\\
MC+FB+D & 1 & 1 & 50.0\%\\
\hline
\end{tabular}%}
\end{table}
因此我caption在序言中调用了包,并添加了环境table和标签\label{tab:overwiew},以便能够引用该表\ref{tab:overwiew}。
我使用命令\footnote来包含脚注:
\emph{MOOCs}\footnote{We choose this category as it is a popular on on the edX platform.} % <==================
要获得跨越两列的表格,只需使用环境table*或figure*图形......
请按照我的提示重新修改你的代码...