

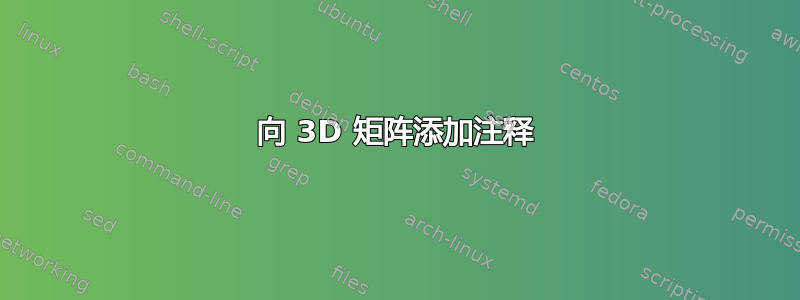
我想在 3D 矩阵中添加一些注释。矩阵是通过以下 LaTeX 代码构建的,如图所示,我想添加的注释用红色标记(与我的红色标记类似但不完全相同也可以)。
是否有任何乳胶代码可以添加我手动用红色输入的注释?
谢谢
莱罗
        \documentclass[margin=5mm]{standalone}
        \usepackage{tikz}
        \usetikzlibrary{matrix,calc}

        \begin{document}


        \begin{tikzpicture}[every node/.style={anchor=north east,fill=white,minimum width=1.4cm,minimum height=7mm}]
        \matrix (mA) [draw,matrix of math nodes]
        {
            i(W,X_1,Y_3)  &  \cdots & i(W,X_k,Y_3) \\
            i(W_2, X_1,Y_3) &  \cdots & i(W_2,X_k,Y_3) \\
            \vdots          &  \ddots & \vdots         \\
            i(W_j,X_1,Y_3)  &  \cdots & i(W_j,X_k,Y_3) \\
        };
        \matrix (mB) [draw,matrix of math nodes] at ($(mA.south west)+(4.9,1.65)$)
        {
            i(W,X_1,Y_2)  &  \cdots & i(W,X_k,Y_2) \\
            i(W_2, X_1,Y_2) &  \cdots & i(W_2,X_k,Y_2) \\
            \vdots          &  \ddots & \vdots         \\
            i(W_j,X_1,Y_2)  &  \cdots & i(W_j,X_k,Y_2) \\
        };
        \matrix (mC) [draw,matrix of math nodes] at ($(mB.south west)+(4.9,1.65)$)
        {
            i(W,X_1,Y_1)  &  \cdots & i(W,X_k,Y_1) \\
            i(W_2, X_1,Y_1) &  \cdots & i(W_2,X_k,Y_1) \\
            \vdots          &  \ddots & \vdots         \\
            i(W_j,X_1,Y_1)  &  \cdots & i(W_j,X_k,Y_1) \\
        };
        \draw[dashed](mA.north east)--(mC.north east);
        \draw[dashed](mA.north west)--(mC.north west);
        \draw[dashed](mA.south east)--(mC.south east);
        \end{tikzpicture}%


        \end{document}

答案1
我确信有更好的tikz方法,但我决定尝试一下\stackinset并\slantbox达到效果。
        \documentclass[margin=5mm]{standalone}
        \usepackage{tikz,stackengine,mathtools}
        \usetikzlibrary{matrix,calc}
\newsavebox{\foobox}
\newcommand{\slantbox}[2][\slantvalue]{\mbox{%
        \sbox{\foobox}{#2}%
        \hskip\wd\foobox
        \pdfsave
        \pdfsetmatrix{1 0 #1 1}%
        \llap{\usebox{\foobox}}%
        \pdfrestore
}}
        \begin{document}
\setbox0=\hbox{
        \begin{tikzpicture}[every node/.style={anchor=north east,fill=white,minimum width=1.4cm,minimum height=7mm}]
        \matrix (mA) [draw,matrix of math nodes]
        {
            i(W,X_1,Y_3)  &  \cdots & i(W,X_k,Y_3) \\
            i(W_2, X_1,Y_3) &  \cdots & i(W_2,X_k,Y_3) \\
            \vdots          &  \ddots & \vdots         \\
            i(W_j,X_1,Y_3)  &  \cdots & i(W_j,X_k,Y_3) \\
        };
        \matrix (mB) [draw,matrix of math nodes] at ($(mA.south west)+(4.9,1.65)$)
        {
            i(W,X_1,Y_2)  &  \cdots & i(W,X_k,Y_2) \\
            i(W_2, X_1,Y_2) &  \cdots & i(W_2,X_k,Y_2) \\
            \vdots          &  \ddots & \vdots         \\
            i(W_j,X_1,Y_2)  &  \cdots & i(W_j,X_k,Y_2) \\
        };
        \matrix (mC) [draw,matrix of math nodes] at ($(mB.south west)+(4.9,1.65)$)
        {
            i(W,X_1,Y_1)  &  \cdots & i(W,X_k,Y_1) \\
            i(W_2, X_1,Y_1) &  \cdots & i(W_2,X_k,Y_1) \\
            \vdots          &  \ddots & \vdots         \\
            i(W_j,X_1,Y_1)  &  \cdots & i(W_j,X_k,Y_1) \\
        };
        \draw[dashed](mA.north east)--(mC.north east);
        \draw[dashed](mA.north west)--(mC.north west);
        \draw[dashed](mA.south east)--(mC.south east);
        \end{tikzpicture}%
}
\kern10pt%
\stackinset{r}{20pt}{b}{8pt}{\rotatebox{-130}{\slantbox[-.81]{$\mid\!\xleftrightarrow{~~~~~\rotatebox{180}{$\Delta y$}~~~~~}\!\mid$}}}{%
\stackinset{l}{-21pt}{b}{67pt}{\rotatebox{90}{$\mid\!\xleftrightarrow{~~~\rotatebox{-90}{$\Delta w$}~~~}\!\mid$}}{%
\stackinset{c}{-35pt}{b}{-18pt}{$\mid\!\xleftrightarrow{\textstyle~~~\Delta x~~~}\!\mid$}{%
  \copy0
}}}

        \end{document}
