

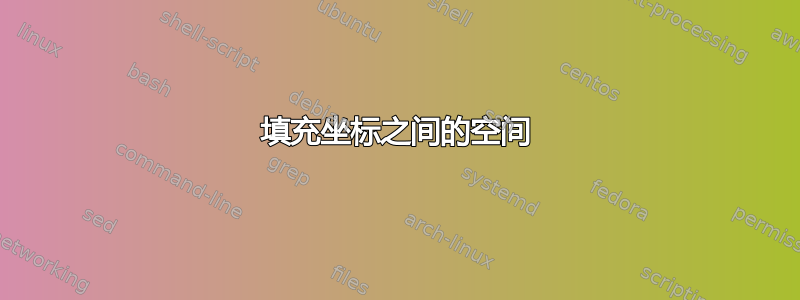
由于我没能绘制出累积分布函数,我尝试绘制一些路径(这只是为了演示目的)。不幸的是,我无法填充两个“函数”之间的空间。较大的函数应该用灰色填充,较小的函数应该用黑色填充。有人能帮帮我吗?
 \documentclass[a4paper,
    bibliography=totoc,
    toc=listof,
    %chapterentrydots=on,
    captions=tableheading,
    headings=small,
    listof=entryprefix]
    {scrbook}

\usepackage[utf8]{inputenc}
\usepackage{textcomp}
\usepackage[T1]{fontenc}
\usepackage[english,german,ngerman]{babel}
\usepackage{lmodern}
\usepackage{scrlayer-scrpage}
\usepackage{microtype}
\usepackage{ragged2e}
\usepackage[format=hang,skip=2.5pt,justification=RaggedRight,singlelinecheck=false,labelfont=bf]{caption}
\usepackage{etoolbox}
\usepackage{booktabs}
\newcommand{\tabitem}{~~\llap{\textbullet}~~}
\newcommand\mc[1]{\multicolumn{2}{p{\dimexpr0.85\linewidth-3\tabcolsep\relax}}{#1}}
\usepackage{pdflscape}
\usepackage{lscape}
\usepackage{tabularx}
\usepackage{tabulary}
\usepackage{longtable}
\usepackage{tabu}
\usepackage{array}
\usepackage[figuresright]{rotating}
\usepackage{enumitem}
\usepackage{amssymb}
\usepackage[default]{sourcesanspro}

\usepackage{fp}
\usepackage{tikz}
\usepackage{xcolor}
\usetikzlibrary{positioning,shadings}
\usetikzlibrary{arrows.meta}
\usetikzlibrary{arrows}
\usetikzlibrary{shapes}
\usetikzlibrary{decorations.pathmorphing}
\usetikzlibrary{decorations.pathreplacing}
\usetikzlibrary{decorations.shapes}
\usetikzlibrary{decorations.text}
\usetikzlibrary{calc}

\usepackage{pgfplots}
\pgfplotsset{compat=1.8}

\usepackage[normalem]{ulem}
\usepackage{soul}
\setul{0.25ex}{}

\usepackage[active,tightpage]{preview}
\PreviewEnvironment{tikzpicture}

\usetikzlibrary{intersections}
\usepgfplotslibrary{fillbetween}


\begin{document}

\begin{center}
        \scalebox{3}{


\begin{tikzpicture}[domain=0:500,smooth,node distance = 0cm, auto]

  \pgfdeclarelayer{pre main}
  \pgfsetlayers{pre main,main}

\begin{axis}[
      width=12cm,height=12cm,
      axis lines=middle,
      domain=0:400,
      smooth,
      no markers,
      xmin=0,xmax=350,
      tick style=white,
      xtick={0,100,200},
      xlabel={x},
      yticklabel style=white,
      xticklabel style=white,
      xlabel style={right},
      restrict y to domain=0:350,
      ymin=0,ymax=400,
      ytick={0,100,200,300},
      ylabel={F(x), G(x)},
      ylabel style={above}]

\end{axis}


\draw [name path=line1, black] plot [smooth,tension=0.4] coordinates {(0,0) (4.2976,1.1513) (7,8.5) (9.5,9.5)};
\draw [name path=line2,densely dotted, black] plot [smooth,tension=0.8] coordinates {(0,0) (3,2) (7,7.5) (9.5,9.5)};

\path [name path=1and2, intersection segments={of=line1 and line2,sequence={A1[reverse] -- B1}}];

\pgfonlayer{pre main}
\fill [black!40,intersection segments={
       of=1and2 and line2,
        sequence={A1 -- B1[reverse]},}];
\endpgfonlayer


\draw [black, densely dashed] (0,9.5) -- (9.5,9.5) -- (9.5,0);
\node [circle,inner sep=1pt, fill, radius=10pt] at (0,9.5) {};
\node [][left] at (0,9.5) {$1$};
\node [circle,inner sep=1pt, fill, radius=10pt] at (9.5,9.5) {};
\node [circle,inner sep=1pt, fill, radius=10pt][] at (9.5,0) {};


\end{tikzpicture}}
\end{center}
\end{document}
编辑:与此同时,我设法绘制了累积分布函数 (CDF),并且@Zarko 的回复效果很好。不幸的是,接下来出现了几个问题。
% gnuplot is needed
% enter "PATH": c:\programme\gnuplot\bin
% pdfLaTeX: pdflatex -synctex=1 -interaction=nonstopmode -enable-write18 %.tex

\documentclass{minimal}
\usepackage{amsmath}

\usepackage{pgfplots}
\pgfplotsset{compat=1.8}
\usepgfplotslibrary{fillbetween}
\pgfdeclarelayer{pre main}
\pgfsetlayers{pre main,main}

\usepackage{scrlayer-scrpage}
\usepackage{pdflscape}


\usepackage[default]{sourcesanspro}


\def\cdf(#1)(#2)(#3){0.5*(1+(erf((#1-#2)/(#3*sqrt(2)))))}
\def\cdfx(#1)(#2)(#3){0.5*(1+(erf((#1-#2)/(#3*sqrt(2)))))}

\DeclareMathOperator{\CDF}{cdf}

\begin{document}
\begin{tikzpicture}
\begin{axis}[
      width=12cm,height=12cm,
      ymin=0,ymax=1.1,
      %xmin=-5.1, %Please turn on to see the "missing tail"!
      xmax=6,
      axis x line=center,
      axis y line=left,
      xlabel={$x$},
      xtick=\empty,
      xlabel style={right},
      ytick=\empty,
      ylabel={$F(x)$, $G(x)$},
      ylabel style={above}, %Why is this not working? Label still "left"
      smooth,
      no markers,
      clip=false
      ]


\addplot[smooth,black,name path=A, tick] gnuplot{\cdf(x)(0)(1)} node[right,pos=0.5, xshift=2ex]{$F$} node[right,pos=0.5, xshift=-12ex, yshift=0.75ex]{$G$};
\addplot[smooth,black,densely dashed,name path=B, tick]gnuplot{\cdfx(x+0.5)(0)(0,2)};
% Why is the tail on the left side of the graph missing?!

\pgfonlayer{pre main}
\tikzfillbetween[of=A and B, split, every even segment/.style={black}]{black!35};
\endpgfonlayer


\draw [black, densely dotted](0,100)--(1000,100)--(1000,0);

\node at (10,100){$1$}; % \node at (-10,100){$1$} Does not work - "1" disapears!


\end{axis}
\end{tikzpicture}
\end{document}
标签定位(Y轴)不起作用。
图表的左尾缺失。
y 轴上的节点(“1”)消失。

有什么想法吗?非常感谢!
答案1
我必须承认我快要迷失在你的代码中了...但是从你问题的描述来看,我猜你看起来是这样的:
(答案第一步)

姆韦生成上述图像的是:
 \documentclass[margin=3mm]{standalone}

\usepackage{pgfplots}
\pgfplotsset{compat=1.15}%1.8}
\usetikzlibrary{arrows, arrows.meta,
                calc,
                decorations.pathmorphing, decorations.pathreplacing,
                decorations.shapes, decorations.text,
                intersections,
                positioning,
                shadings, shapes}
\usepgfplotslibrary{fillbetween}
    \pgfdeclarelayer{pre main}
    \pgfsetlayers{pre main,main}

\begin{document}
\begin{tikzpicture}
\begin{axis}[
      width=12cm,height=12cm,
      axis lines=middle,
      xmin=0,xmax=11,
      xlabel={$x$},
      xtick={0, 2.5, 5, 7.5, 10},
      xlabel style={right},
      restrict y to domain=0:9,
      ymin=0,ymax=10,
      ylabel={$F(x)$, $G(x)$},
      ylabel style={above},
      domain=0:10,
      samples=40,
      smooth,
      no markers,
]

\draw [name path=A] plot coordinates {(0,0) (4.2976,1.1513) (7,8.5) (9.5,9.5)};
\draw [name path=B,densely dotted] plot coordinates {(0,0) (3,2) (7,7.5) (9.5,9.5)};
\pgfonlayer{pre main}
\tikzfillbetween[of=A and B,
                 split,
                 every even segment/.style={red}
                 ]{blue}; % <-- added fill between paths A and B
\endpgfonlayer
\end{axis}
\end{tikzpicture}
\end{document}
编辑:
- 在上面姆韦是使用
pgfplotsd版本1.15. 您使用的 1.68 版本无法正常运行。我强烈建议您将pgfplots安装升级到最新版本。 - 您的图片代码有误。通过比较,可以发现您的代码与上面提出的代码之间的区别
- 从
axis参数中我删除了所有多余的选项。 - 汇编你的姆韦被冻住了
考虑到您的文档序言,在重组和删除多余的包,以及对图像代码进行微小更改并添加在第一步中删除的图像部分后,我获得(第二步);

\documentclass[a4paper,
               bibliography=totoc,
               toc=listof,
               %chapterentrydots=on,
               captions=tableheading,
               headings=small,
               listof=entryprefix]
               {scrbook}
% page layout
\usepackage{scrlayer-scrpage}
\usepackage{pdflscape}

% encoding and babel
\usepackage[utf8]{inputenc}
\usepackage[T1]{fontenc}
\usepackage[english,german,ngerman]{babel}
% fonts
\usepackage{textcomp}
\usepackage{lmodern}
\usepackage{amssymb}
\usepackage[default]{sourcesanspro}
\usepackage{microtype}
% captions and figures
\usepackage[format=hang,
            skip=2.5pt,
            justification=RaggedRight,
            singlelinecheck=false,
            labelfont=bf]{caption}
\usepackage[figuresright]{rotating}
% for tables
\usepackage{ragged2e}
\usepackage{booktabs, longtable, tabu, tabularx, tabulary}
\newcommand{\tabitem}{~~\llap{\textbullet}~~}
\newcommand\mc[1]{\multicolumn{2}{p{\dimexpr0.85\linewidth-3\tabcolsep\relax}}{#1}}

\usepackage{enumitem}

\usepackage{fp}
\usepackage{etoolbox}
% for pgfplots and tikz images
\usepackage{pgfplots}
\pgfplotsset{compat=1.15}% with version 1.8 doesn't work well
\usetikzlibrary{arrows, arrows.meta,
                calc,
                decorations.pathmorphing, decorations.pathreplacing,
                decorations.shapes, decorations.text,
                intersections,
                positioning,
                shadings, shapes}
\usepgfplotslibrary{fillbetween}
    \pgfdeclarelayer{pre main}
    \pgfsetlayers{pre main,main}

\usepackage[active,tightpage]{preview}% only for test purposes
\PreviewEnvironment{tikzpicture}

\begin{document}
    \begin{tikzpicture}[
dot/.style={circle,fill,inner sep=0pt,minimum size=4pt,
            node contents={}}
                        ]
\begin{axis}[
      width=12cm,height=12cm,
      axis lines=middle,
      xmin=0,xmax=11,
      xlabel={$x$},
      xtick=\empty,
      xlabel style={right},
      restrict y to domain=0:9,
      ymin=0,ymax=10,
      ytick=\empty,
      ylabel={$F(x)$, $G(x)$},
      ylabel style={above},
      domain=0:10,
      samples=40,
      smooth,
      no markers,
      clip=false
]

\draw [name path=A,thick] plot coordinates {(0,0) (4.2976,1.1513) (7,8.5) (9.5,9.5)};
\draw [name path=B,thick,densely dotted] plot coordinates {(0,0) (3,2) (7,7.5) (9.5,9.5)};
\pgfonlayer{pre main}
\tikzfillbetween[of=A and B,
                 split,
                 every even segment/.style={red!30}
                 ]{blue!30}; % <-- added fill between paths A and B
\endpgfonlayer
%
\draw [very thin, densely dashed]
        (0,9.5)     node[dot,label=left:???] --
        (9.5,9.5)   node[dot] --
        (9.5,0)     node[dot,label=below:1];
\node [circle,inner sep=1pt, fill, radius=10pt] at (0,9.5) {};
\end{axis}
\end{tikzpicture}
\end{document}