

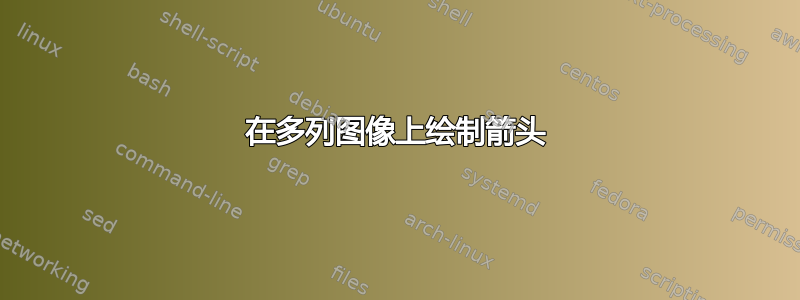
[![在此处输入图片描述][1]][1] 我想从我的 latex 文档中的一个图形中绘制两个箭头(它实际上是一张海报)。与此处的图片相同。我想使用“多列”排列下面的两幅图像。这可能很容易,但我是 Latex 的初学者,不知何故我无法做到这一点。以下是我到目前为止所做的:
    \documentclass[landscape,a0paper,fontscale=0.32,margin=25mm]{baposter} % Adjust the font scale/size here

    \usepackage{graphicx} % Required for including images
    \graphicspath{{myfigures/}} % Directory in which figures are stored

    \usepackage{amsmath} % For typesetting math
    \usepackage{amssymb} % Adds new symbols to be used in math mode
    \usepackage[export]{adjustbox}
    \usepackage{booktabs} % Top and bottom rules for tables
    \usepackage{enumitem} % Used to reduce itemize/enumerate spacing
    %\usepackage{palatino} % Use the Palatino font
    \usepackage[font=small,labelfont=bf]{caption} % Required for specifying captions to tables and figures
    \usepackage{ragged2e} % for text alignment

    \usepackage{helvet}
    \renewcommand{\familydefault}{\sfdefault}

    \usepackage {xcolor}\usepackage{xcolor,colortbl}

    \usepackage{multicol} % Required for multiple columns
    \setlength{\columnsep}{0.5em} % Slightly increase the space between columns
    \setlength{\columnseprule}{0mm} % No horizontal rule between columns
    \usepackage{tikz} % Required for flow chart
    \usetikzlibrary{shapes,arrows} % Tikz libraries required for the flow chart in the template
    \usepackage[export]{adjustbox}
    \newcommand{\compresslist}{ % Define a command to reduce spacing within itemize/enumerate environments, this is used right after \begin{itemize} or \begin{enumerate}
    \setlength{\itemsep}{0pt}
    \setlength{\parskip}{0pt}
    \setlength{\parsep}{0pt}
    %\setlist{noitemsep}{format}

    %\setlist[itemize]{leftmargin=*}
    %\setsansfont{HelveticaNeue}
    \newcommand{\squeezeup}{\vspace{-2.5mm}} % To utilize space between text and image

    \renewcommand{\sfdefault}{textsf}
    \setmainfont{\textsf{Sample Text 0123}}


    }

    \definecolor{Turquoise}{rgb}{0.145,0.6666,1} % Defines the color used for content box headers
    \definecolor{uscgold}{rgb}{1,0.6,0}
    \definecolor{skyblue}{rgb}{0.53, 0.81, 0.92}
    \begin{document}

    \begin{poster}
    {
    headerborder=open, % Adds a border around the header of content boxes
    headershade=plain,
    %headershade=shade-lr
    colspacing=0.4em, % Column spacing
    bgColorOne=white, % Background color for the gradient on the left side of the poster
    bgColorTwo=white, % Background color for the gradient on the right side of the poster
    borderColor=Turquoise, % Border color
    headerColorOne= skyblue,%Turquoise, % Background color for the header in the content boxes (left side)
    %headerColorTwo=uscgold, % Background color for the header in the content boxes (right side)
    headerFontColor=Turquoise, % Text color for the header text in the content boxes
    boxColorOne=white, % Background color of the content boxes
    textborder=roundedsmall, % Format of the border around content boxes, can be: none, bars, coils, triangles, rectangle, rounded, roundedsmall, roundedright or faded
    eyecatcher=true, % Set to false for ignoring the left logo in the title and move the title left
    headershape=rounded, % Specify the rounded corner in the content box headers, can be: rectangle, small-rounded, roundedright, roundedleft or rounded
    headerheight=0.1 \textheight, % Height of the header
    headerfont=\Large\bf\textsf, % Large, bold and sans serif font in the headers of content boxes
    %textfont={\setlength{\parindent}{1.5em}}, % Uncomment for paragraph indentation
    linewidth=2pt % Width of the border lines around content boxes
    }

    \headerbox{Introduction}{name=introduction,column=0,span=1}
    \begin{center}
                    \vspace{-0.3em}

        \begin{tikzpicture}[remember picture]
          \node[anchor=south west,inner sep=0] (imageA) {\includegraphics[height=2cm]{spri}};
          \begin{scope}[x={(imageA.south west)},y={(imageA.north east)}]
            \node[coordinate] (A) at (0.4,0.5) {};
          \end{scope}
        \end{tikzpicture}
        \begin{tikzpicture}[remember picture]
          \node[anchor=south west,inner sep=0] (imageB) {\includegraphics[height=2cm]{apr}};
          \begin{scope}[x={(imageB.south west)},y={(imageB.north east)}]
            \node[coordinate] (B) at (0.3,0.3) {};
          \end{scope}
        \end{tikzpicture}
        \begin{tikzpicture}[remember picture,overlay]
          \draw[->] (A) -- (B);
        \end{tikzpicture}

        \begin{tikzpicture}[remember picture]
          \node[anchor=south west,inner sep=0] (imageB) {\includegraphics[height=2cm]{slr}};
          \begin{scope}[x={(imageB.south west)},y={(imageB.north east)}]
            \node[coordinate] (B) at (0.3,0.3) {};
          \end{scope}
        \end{tikzpicture}
        \begin{tikzpicture}[remember picture,overlay]
          \draw[->] (A) -- (B);
        \end{tikzpicture}
    \end{center}
\begin{multicols}{2}
                \vspace{-1.7cm}
                \subsection*{ Domain 2}
 \includegraphics[width=2.5cm,scale=0.016]{domain1}
                \subsection*{Domain 3} \hspace{0.8cm}
    %           \includegraphics[width=2.5cm,scale=0.016]{domain2}
                \end{multicols}
                \vspace{-1cm}

    }
\end{poster}
有人能告诉我应该把多列放在哪里,以及如何获得如上图所示的图像吗?提前谢谢。
这实际上就是我想要做的。多个箭头显示区域,并在其上方显示区域名称。
[![在此处输入图片说明][2]][2] [![在此处输入图片说明][3]][3] [![在此处输入图片说明][4]][4]
答案1
我下载了 baposter.cls,但无法编译你的文档。所以我从这里并从您的代码中添加了图形。然后我重新排列了图形,经过多次迭代后获得了
\documentclass[portrait,final,a0paper,fontscale=0.32]{baposter}
% except for the figure, everything is from https://tex.stackexchange.com/a/253179/121799
\usepackage{lipsum}
\usepackage{tcolorbox}
\usetikzlibrary{decorations.text}

\setlength{\columnsep}{1.5em}
\setlength{\columnseprule}{0mm}

\begin{document}

\definecolor{lightblue}{rgb}{0.145,0.6666,1}
\hyphenation{resolution occlusions}

\begin{poster}%
  % Poster Options
  {
  % Show grid to help with alignment
  grid=false,
  % Column spacing
  colspacing=1em,
  % Color style
  bgColorOne=white,
  bgColorTwo=white,
  borderColor=lightblue,
  headerColorOne=black,
  headerColorTwo=lightblue,
  headerFontColor=white,
  boxColorOne=white,
  boxColorTwo=lightblue,
  textborder=roundedleft,
  eyecatcher=true,
  headerborder=closed,
  headerheight=0.15\textheight,
  headershape=roundedright,
  headershade=shadelr,
  headerfont=\Large\bf\textsc, %Sans Serif
  textfont={\setlength{\parindent}{1.5em}},
  boxshade=plain,
  background=plain,
  linewidth=2pt
  }
  % Eye Catcher
  {}
  %{\includegraphics[height=5em]{images/logoUPM.pdf}}
  % Title
  {\bf\textsc{Tittle}\vspace{0.5em}}
  % Authors
  {Authors\\
   University\\
    [email protected]}


  \headerbox{Abstract}{name=problem,column=0,span=3, row=0}{
Text

    }
  \headerbox{Introduction}{name=introduction,column=0,  below=problem}{
Text

  }

  \headerbox{References}{name=references,column=0, above=bottom}{
Text

  }

  \headerbox{Conclusions}{name=results,column=1,span=2, above=bottom}{
Text

 }
 \headerbox{Results}{name=Shaped-Beam,below=problem, above=results,column=1,span=2,row=0}{
\section*{First result}
\lipsum[1]
\begin{tcolorbox}[colback=blue!5!white,colframe=blue!75!black,title=Second result]
Awesome results.
\tcblower
\lipsum[2]
\end{tcolorbox}  }

  \headerbox{Some Maths}{name=method,column=0,below=introduction,above=references}{

Text

\def\myshift#1{\raisebox{1ex}} % from https://tex.stackexchange.com/a/22316/121799
    \begin{center}
        \begin{tikzpicture}[remember picture]
          \node[anchor=south west,inner sep=0,label={[above=2mm]:Europe}] (imageA)
          {\includegraphics[height=2cm]{imgA.png}};
%         \draw[help lines] (imageA.south west) grid[step=1mm] (imageA.north east); %<-remove in the end
          \node[anchor=north west,xshift=1mm,yshift=-1mm](label) at (imageA.north west)
          {some text};
          \coordinate (startB) at (1.05,0.58);
          \coordinate (startC) at (1.13,0.65);
        \end{tikzpicture}\\[0.8cm] %<- to make the pictures not sit too closely
        \begin{tikzpicture}[remember picture]
          \node[anchor=south west,inner sep=0,label={[name=s,yshift=-2mm]below:Switzerland}] (imageB)
          {\includegraphics[height=2cm]{imgB.jpg}};
        \end{tikzpicture}~~~
        \begin{tikzpicture}[remember picture]
          \node[anchor=south west,inner sep=0,label={[name=m,yshift=-2mm]below:Marmot
          sanctuaries}] (imageC)
          {\includegraphics[height=2cm]{imgC.jpg}};
        \end{tikzpicture}
        \begin{tikzpicture}[remember picture,overlay]
          \draw[thick,latex-,postaction={decorate,decoration={text along
          path,text align=center,text={|\sffamily\tiny\myshift|Swiss marmots}}}]
          (imageB.north) to[out=90,in=-90] (startB);
          \draw[thick,-latex,postaction={decorate,decoration={text along
          path,text align=center,text={|\sffamily\tiny\myshift|marmot
          sanctuaries}}}] (startC) to[out=0,in=90] (imageC.north);
        \end{tikzpicture}
    \end{center}
}

\end{poster}

\end{document}