

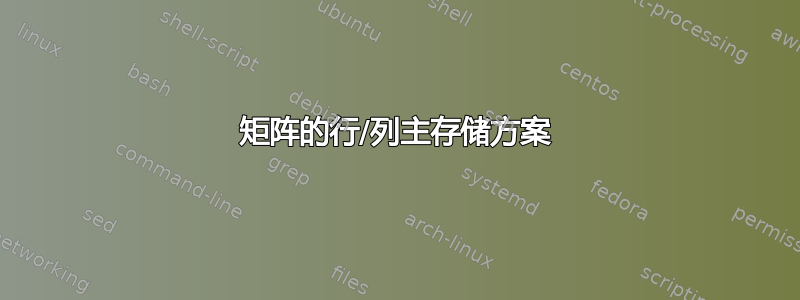
你好,我想绘制一个 tikzpicture 来以图形方式表示二维数组的行主序(用于 C++/C)和列主序(FOTRAN)存储方案,类似于下面的图片(行主存储,C++布局):

到目前为止,我已经能够生成绘制方框的代码,但我不确定如何绘制遵循上图所示图案的箭头。代码如下所示:
\documentclass{standalone}
\usepackage{tikz}
\begin{document}
\begin{tikzpicture}
%xscale = 1.25 will increase horizontal size and spacing
%yscale with a negative sign makes the (0,0) at the top right corner
[>=stealth,x=0.75pt,y=0.75pt,yscale=-1,xscale=1.25]

 \foreach \x in  {0,...,4}
    \foreach \y in  {0,...,4 }
     \foreach \position in {(50*\x,50*\y)}
            { \draw[thick] \position rectangle +(30,30) node[pos=0.5] {(\y,\x)} ;}


\end{tikzpicture}
\end{document}
生成的图像为:

如果有人能告诉我以行主格式(以及以列主格式,其中箭头从第一列垂直向上到下开始,箭头头在最后一列的底部结束)绘制 tikz 箭头的正确方法,那将非常有帮助
答案1
你自己的解决方案已经很不错了。下面是一些建议,可能会让放置括号变得更容易。
\documentclass[tikz,border=3.14mm]{standalone}
\usetikzlibrary{positioning}
\begin{document}
\begin{tikzpicture}[x={(1pt,0)},y={(0,1pt)}]
\draw[line width=3pt,gray!50,-stealth] (-20,0)
\foreach \y in {0,...,3}
{ --  (250,-50*\y) arc(90:-90:12.5)
--  (-20,-25-50*\y) arc(90:270:12.5)
-- (-20,-50-50*\y) -- (250, -50-50*\y)
} --(255,-200);
\foreach \x in  {0,...,4}
{\foreach \y in {0,...,4}
 { \node[draw,fill=white] at (12.5+50*\x,-50*\y) (X-\x-\y){(\x,\y)};}
}
\node[left=1mm of X-0-0] {[};
\path (X-3-0) -- (X-4-0) node[midway]{][};
\path (X-2-1) -- (X-3-1) node[midway]{][};
\path (X-1-2) -- (X-2-2) node[midway]{][};
\path (X-0-3) -- (X-1-3) node[midway]{][};
\node[left=1mm of X-0-4] {][};
\path (X-3-4) -- (X-4-4) node[midway]{][};
\end{tikzpicture}
\end{document}

答案2
到目前为止,我对行主存储方案的解决方案如下所示:
\documentclass[tikz,border=3.14mm]{standalone}
\usetikzlibrary{positioning}
\begin{document}
\begin{tikzpicture}[>=stealth,x=0.75pt,y=0.75pt,yscale=-1,xscale=1.25,color=black,line width=1.25mm, opacity=1]
%xscale = 1.25 will increase horizontal size and spacing
%yscale with a negative sign makes the (0,0) at the top right corner

%boxes with numbers
 \foreach \x in  {0,...,4}
    \foreach \y in  {0,...,4 }
     \foreach \position in {(50*\x,50*\y)}
            { \draw[thick] \position rectangle +(30,30) node[pos=0.5] {(\y,\x)} ;}

%lines through the boxes
\tikzstyle{arrow} = [->,>=stealth,color=black,line width=1.25mm, opacity=1]
\foreach \x in {0,...,5}
\foreach \y in {0,...,4}
{\draw  (-20+50*\x,15+50*\y) -- (00+50*\x,15+50*\y);
}
\draw[arrow] (230,215) -- (270,215);  %arrow head at box (4,4)

%arcs at the end
\foreach \y in {0,...,3}
{\draw  (250,15+50*\y) arc(270:455:12.5);
\draw (-20,65+50*\y) arc(90:270:12.5);
\draw (-22,40+50*\y) -- (251, 40+50*\y);
}
\end{tikzpicture}
\end{document}
生成的图片如下所示:

更新 1(6 月 7 日):添加列主格式的代码
\documentclass[tikz,border=3.14mm]{standalone}
\usetikzlibrary{positioning}
\begin{document}
\begin{tikzpicture}[>=stealth,x=0.75pt,y=0.75pt,yscale=-1,xscale=1.25,color=black,line width=1.25mm, opacity=1]

 \foreach \x in  {0,...,4}
    \foreach \y in  {0,...,4 }
     \foreach \position in {(50*\x,50*\y)}
            { \draw[thick] \position rectangle +(30,30) node[pos=0.5] {(\y,\x)} ;} %boxes with numbers

%lines through the boxes
\tikzstyle{arrow} = [->,>=stealth,line width=1.25mm, opacity=1]
\foreach \x in {0,...,5}
\foreach \y in {0,...,4}
{\draw (15+50*\y,-20+50*\x) -- (15+50*\y,00+50*\x);
}
\draw[arrow] (215,230) -- (215,270);  %arrow head at box (4,4)

\foreach \y in {0,...,3}
{\draw  (15+50*\y,250) arc(180:00:12.5)  ; %bottom arcs
\draw (40+50*\y,-20) arc(-180:1:12.5); %top arcs
\draw (40+50*\y, -20) -- (40+50*\y, 250)  ; %vertical lines in between boxes
}
\end{tikzpicture}
\end{document}
得到的 tikzpicture 是:

答案3
只是为了好玩,使用自动填充矩阵和背景上的一条路径的解决方案。
\documentclass[tikz, margin=2mm]{standalone}
\usepackage{tikz}
\usetikzlibrary{matrix,backgrounds,arrows.meta}

\begin{document}
\begin{tikzpicture}[%
    arraynode/.style={
        draw,
        fill=white,
        node contents={(\the\numexpr\pgfmatrixcurrentrow-1\relax,
                        \the\numexpr\pgfmatrixcurrentcolumn-1\relax)},
        alias=n\the\numexpr\pgfmatrixcurrentrow-1\relax\the\numexpr\pgfmatrixcurrentcolumn-1\relax
        },
    array/.style={%
        matrix of math nodes,
        nodes = arraynode,
        column sep=5mm,
        row sep={1cm,between origins},  %<-No space before `between`
        nodes in empty cells},
]

\matrix[array] {
&&&&\\
&&&&\\
&&&&\\
&&&&\\
&&&&\\};

\node at ([xshift=-2.5mm]n00.west) {$[$};
\foreach \i in {40,31,22,13,04,44}
    \node at ([xshift=-2.5mm]n\i.west) {$][$};

\begin{scope}[on background layer]
\draw[-{LaTeX}, line width=3pt, black!30] ([xshift=-7.5mm]n00.west)
      foreach \i [count=\ni from 0] in {0,...,3}{
         -- ([xshift=5mm]n\i4.east) arc(90:-90:2.5mm)
         -- ([shift={(-5mm,-5mm)}]n\i0.west) arc(90:270:2.5mm)}
         -- ([xshift=7.5mm]n44.east);
\end{scope}

\end{tikzpicture}

\begin{tikzpicture}[%
    arraynode/.style={
        draw,
        fill=white,
        node contents={(\the\numexpr\pgfmatrixcurrentrow-1\relax,
                        \the\numexpr\pgfmatrixcurrentcolumn-1\relax)},
        alias=n\the\numexpr\pgfmatrixcurrentrow-1\relax\the\numexpr\pgfmatrixcurrentcolumn-1\relax
        },
    array/.style={%
        matrix of math nodes,
        nodes = arraynode,
        column sep={14mm,between origins}, %<-No space before `between`
        row sep=5mm,
        nodes in empty cells},
]

\matrix[array] {
&&&&\\
&&&&\\
&&&&\\
&&&&\\
&&&&\\};

\begin{scope}[on background layer]
\draw[-{LaTeX}, line width=3pt, black!30] ([yshift=7.5mm]n00.north)
        foreach \i [count=\ni from 0] in {0,...,3}{
           -- ([yshift=-5mm]n4\i.south) arc(180:360:3.5mm)
           -- ([shift={(7mm,5mm)}]n0\i.north) arc(180:0:3.5mm)}
           -- ([yshift=-7.5mm]n44.south);
\end{scope}
\end{tikzpicture}
\end{document}
