

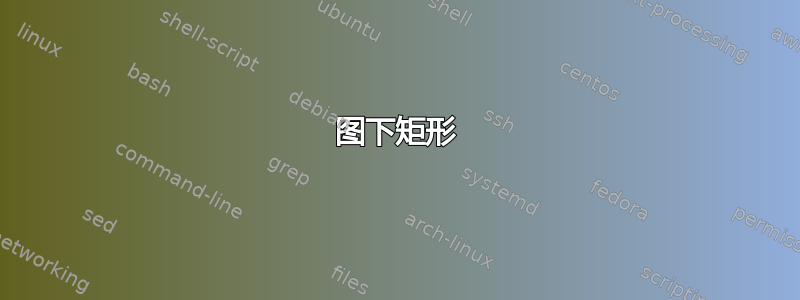
有人知道为什么这段代码不起作用吗?我试图在曲线下放置一个矩形,但不知为何它给出了非常奇怪的响应。
\doucmentclass{standalone}
\usepackage{pgfplots}
\usepackage{tkz-euclide}

\begin{document}
\begin{tikzpicture}
\begin{axis}[
  axis x line=middle, axis y line=middle,
  ymin=-5, ymax=10, ytick={-4,-2,...,10}, ylabel=$f(x)$,
  xmin=0, xmax=6, xtick={0,2,...,10}, xlabel=$x$,
  domain=0:6,samples=101, %added
]
\addplot[domain=0:6,blue,name path=A] {-0.25*x^3+2.5*x^2-8*x+10};
\coordinate (A) at (1,0);
\coordinate (B) at (1,4.25);
\coordinate (C) at (2,4.25);
\coordinate (D) at (2,0);
\draw (A)--(B)--(C)--(D)--cycle;

\end{axis}
\end{tikzpicture}
\end{document}
答案1
除了 @Skillmon 和 @Phelype Oleinik 指出的事项外,您不需要tkz-euclide在这里这样做,而且构造矩形的方式不必要地复杂。此外,除非您将兼容性设置为1.11或更新版本,或者在坐标前面加上axis cs:,否则矩形不会显示,但我更喜欢第一个选项。由于您正在使用 pgfplots,我猜您可能想要加载\usepgfplotslibrary{fillbetween},这会加载intersections但允许您做更多的事情。此时,当然这两个库都没有使用。
\documentclass{standalone}
\usepackage{pgfplots}
\usepgfplotslibrary{fillbetween}
\pgfplotsset{compat=1.16}
\begin{document}
\begin{tikzpicture}
\begin{axis}[
  axis x line=middle, axis y line=middle,
  ymin=-5, ymax=10, ytick={-4,-2,...,10}, ylabel=$f(x)$,
  xmin=0, xmax=6, xtick={0,2,...,10}, xlabel=$x$,
  domain=0:6,samples=101, %added
]
\addplot[domain=0:6,blue,name path=A] {-0.25*x^3+2.5*x^2-8*x+10};
\coordinate (A) at (1,0);
\coordinate (B) at (1,4.25);
\coordinate (C) at (2,4.25);
\coordinate (D) at (2,0);
\draw (A)  rectangle (C);
\end{axis}
\end{tikzpicture}
\end{document}
