

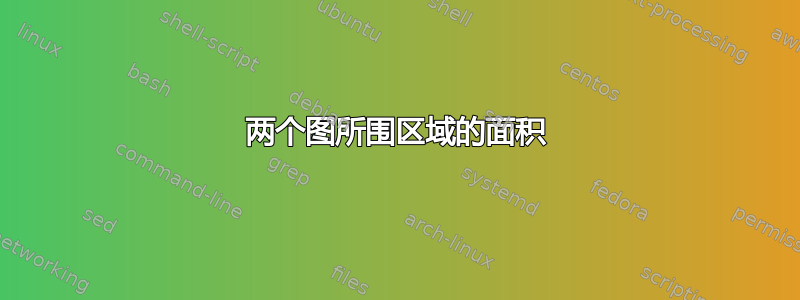
我正在寻找下面更专业的程序。我相信我可以命名曲线并让 TiKz 计算交点,而不是用笔和纸找到它们。我承认在这个构造上花了一个小时。抱歉冗余或多余的评论。
\documentclass{article}
\usepackage{tikz}

\begin{document}
\begin{minipage}{.3\textwidth}
\begin{center}
\begin{tikzpicture}[scale=.5,declare function={g(\x)=(\x-1)^(2)+1;},declare
        function={f(\x)=.5*\x+4;}]
\draw[fill=orange!40!white,dashed]
  plot[domain=-.6375:3.137,samples=167,variable=\x] ({\x},{f(\x)})
    -- (3.137,-2) -| cycle;
 \draw[fill=white,dashed]
   plot[domain=-.6375:3.137,samples=167,variable=\x] ({\x},{g(\x)})
    -- (3.137,-2) -| cycle;
 \draw[domain=-1:3.8,smooth,variable=\x,red,<->,thick] plot ({\x},{g(\x)});
 \draw[domain=-1.4:4.4,smooth,variable=\x,blue,<->,thick] plot ({\x},
   {f(\x)});
 \draw[fill] (-.6375,{g(-.6375)}) circle (4pt);
 \draw[fill] (-.6375,-2) circle (4pt);
 \draw[fill] (3.137,{g(3.137)}) circle (4pt);
 \draw[fill] (3.137,-2) circle (4pt);
 %\draw[domain=-3:-1,smooth,variable=\x,red,<-,thick] plot ({\x},{g(\x)});
 \draw[dashed] (-.6375,{g(-.6375)})--(-.6375,-2) node[below] {$a$};
 \draw[dashed] (3.137,{g(3.137)})--(3.137,-2) node[below] {$b$};
 \draw (-2.25,-2)--(5,-2);
 \node at (3.8,{g(3.8)}) [right,text=red] {$g$};
 \node at (4.4,{f(4.4)}) [right,text=blue] {$f$};
 \node at (1,3) [] {$A$};
 \end{tikzpicture}
 \end{center}
 \end{minipage}
 \hspace{1cm}
 \begin{minipage}{.3\textwidth}
 \begin{center}
 \begin{tikzpicture}[scale=.5,declare function={g(\x)=(\x-1)^(2)+1;},declare
    function={f(\x)=.5*\x+4;}]
 \draw[fill=orange!40!white]
    plot[domain=-.6375:3.137,samples=167,variable=\x] ({\x},{f(\x)})
    -- (3.137,-2) -| cycle;
 %\draw[fill=white,dashed]
 %   plot[domain=-.6375:3.137,samples=167,variable=\x] ({\x},{g(\x)})
 %   -- (3.137,-2) -| cycle;
 %\draw[domain=-1:3.8,smooth,variable=\x,red,<->,thick] plot ({\x},{g(\x)});
 \draw[domain=-1.4:4.4,smooth,variable=\x,blue,<->,thick] plot ({\x},
   {f(\x)});
 \draw[fill] (-.6375,{g(-.6375)}) circle (4pt);
 \draw[fill] (-.6375,-2) circle (4pt);
 \draw[fill] (3.137,{g(3.137)}) circle (4pt);
 \draw[fill] (3.137,-2) circle (4pt);
 %\draw[domain=-3:-1,smooth,variable=\x,red,<-,thick] plot ({\x},{g(\x)});
 \draw[] (-.6375,{g(-.6375)})--(-.6375,-2) node[below] {$a$};
 \draw[] (3.137,{g(3.137)})--(3.137,-2) node[below] {$b$};
 \draw (-2.25,-2)--(5,-2);
 \node at (3.8,{g(3.8)}) [right,text=white] {$g$};
 \node at (4.4,{f(4.4)}) [right,text=blue] {$f$};
 \node at (1,1) [] {$A_{2}$};
 \end{tikzpicture}
 \end{center}
 \end{minipage}
 \hspace{1cm}
 \begin{minipage}{.3\textwidth}
 \begin{center}
 \begin{tikzpicture}[scale=.5,declare function={g(\x)=(\x-1)^(2)+1;},declare
   function={f(\x)=.5*\x+4;}]
   %\draw[fill=white]
   %   plot[domain=-.6375:3.137,samples=167,variable=\x] ({\x},{f(\x)})
   %   -- (3.137,-2) -| cycle;
 \draw[fill=orange!40!white,dashed]
    plot[domain=-.6375:3.137,samples=167,variable=\x] ({\x},{g(\x)})
    -- (3.137,-2) -| cycle;
  \draw[domain=-1:3.8,smooth,variable=\x,red,<->,thick] plot ({\x},{g(\x)});
  %\draw[domain=-1.4:4.4,smooth,variable=\x,blue,<->,thick] plot ({\x},
   {f(\x)});
 \draw[fill] (-.6375,{g(-.6375)}) circle (4pt);
 \draw[fill] (-.6375,-2) circle (4pt);
 \draw[fill] (3.137,{g(3.137)}) circle (4pt);
 \draw[fill] (3.137,-2) circle (4pt);
 %\draw[domain=-3:-1,smooth,variable=\x,red,<-,thick] plot ({\x},{g(\x)});
 \draw[] (-.6375,{g(-.6375)})--(-.6375,-2) node[below] {$a$};
 \draw[] (3.137,{g(3.137)})--(3.137,-2) node[below] {$b$};
 \draw (-2.25,-2)--(5,-2);
 \node at (3.8,{g(3.8)}) [right,text=red] {$g$};
 %\node at (4.4,{f(4.4)}) [right,text=] {$f$};
 \node at (1,1) [below] {$A_{1}$};
 \end{tikzpicture}
 \end{center}
 \end{minipage}

\end{document}
输出:

答案1
pgfplots这是一个加载和使用该库的提案fillbetween,但只有 Ti钾Z 语法。您无需手动计算任何交点。

\documentclass{article}
\usepackage{tikz}
\usepackage{pgfplots}
\pgfplotsset{compat=1.16}
\usepgfplotslibrary{fillbetween}
\usetikzlibrary{backgrounds}
\begin{document}
\begin{minipage}{.3\textwidth}
\centering
\begin{tikzpicture}[scale=.5,declare function={g(\x)=(\x-1)^(2)+1;
        f(\x)=.5*\x+4;}]
 \draw[domain=-1.4:4.4,smooth,variable=\x,blue,<->,thick,name path=f1] plot ({\x},
   {f(\x)});
 \draw[domain=-1:3.8,smooth,variable=\x,red,<->,thick,name path=g1] plot ({\x},{g(\x)});
 \begin{scope}[on background layer]
  \path[fill=orange!40!white,%blue,very thick,
   intersection segments={of=f1 and g1,sequence={A1 -- B1[reverse]}}];
 \end{scope}
 \draw[fill,name intersections={of=f1 and g1,name=I1}]
  (I1-1) circle (4pt) (I1-2) circle (4pt)
  (I1-1|-0,-2) circle (4pt) (I1-2|-0,-2) circle (4pt);
 \draw[dashed] (I1-1)--(I1-1|-0,-2) node[below] {$\mathstrut a$};
 \draw[dashed] (I1-2)--(I1-2|-0,-2) node[below] {$\mathstrut b$};
 \draw (-2.25,-2)--(5,-2);
 \node at (3.8,{g(3.8)}) [right,text=red] {$g$};
 \node at (4.4,{f(4.4)}) [right,text=blue] {$f$};
 \node at (1,3)  {$A$};
 \end{tikzpicture}
\end{minipage}
\hspace{1cm}
\begin{minipage}{.3\textwidth}
\centering
\begin{tikzpicture}[scale=.5,declare function={g(\x)=(\x-1)^(2)+1;
        f(\x)=.5*\x+4;}]
 \draw[domain=-1.4:4.4,smooth,variable=\x,blue,<->,thick,name path=f2] plot ({\x},
   {f(\x)});
 \path[domain=-1:3.8,smooth,variable=\x,<->,name path=g2] plot ({\x},{g(\x)});
 \draw[fill,name intersections={of=f2 and g2,name=I2}]
  (I2-1) circle (4pt) (I2-2) circle (4pt)
  (I2-1|-0,-2) circle (4pt) (I2-2|-0,-2) circle (4pt);
 \begin{scope}[on background layer]
  \path[fill=orange!40!white]
  (I2-1|-0,-2) -- (I2-1) -- (I2-2) -- (I2-2|-0,-2);
 \end{scope}
 \draw (I2-1)--(I2-1|-0,-2) node[below] {$\mathstrut a$};
 \draw (I2-2)--(I2-2|-0,-2) node[below] {$\mathstrut b$};
 \draw (-2.25,-2)--(5,-2);
 \node at (3.8,{g(3.8)}) [right,text=white] {$g$};
 \node at (4.4,{f(4.4)}) [right,text=blue] {$f$};
 \node at (1,1) [] {$A_{2}$};
 \end{tikzpicture}
\end{minipage}
\hspace{1cm}
\begin{minipage}{.3\textwidth}
\centering
 \begin{tikzpicture}[scale=.5,declare function={g(\x)=(\x-1)^(2)+1;
        f(\x)=.5*\x+4;}]
 \path[domain=-1.4:4.4,smooth,variable=\x,name path=f3] plot ({\x},
   {f(\x)});
 \draw[domain=-1:3.8,smooth,variable=\x,red,<->,thick,name path=g3] plot ({\x},{g(\x)});
 \draw[fill,name intersections={of=f3 and g3,name=I3}]
  (I3-1) circle (4pt) (I3-2) circle (4pt)
  (I3-1|-0,-2) circle (4pt) (I3-2|-0,-2) circle (4pt);
 \path[name path=aux] (I3-1) -- (I3-1|-0,-2) -- (I3-2|-0,-2) -- (I3-2) -- cycle;
 \begin{scope}[on background layer]
  \path[fill=orange!40!white,%blue,very thick,
   intersection segments={of=aux and g3,sequence={A0[reverse] -- B1}}];
 \end{scope}
 \draw (I3-1)--(I3-1|-0,-2) node[below] {$\mathstrut a$};
 \draw (I3-2)--(I3-2|-0,-2) node[below] {$\mathstrut b$};
 \draw (-2.25,-2)--(5,-2);
 \node at (3.8,{g(3.8)}) [right,text=red] {$g$};
 \node at (1,1) [below] {$A_{1}$};
\end{tikzpicture}
\end{minipage}
\end{document}