

当我使用整个 Tex 文档编译以下代码时,它会打印逗号。另一方面,如果我在新的单个文档中编译它,它会打印句点。
您知道这可能是什么原因造成的吗?

主要.tex:
    \documentclass[11pt,a4paper,twoside,openright]{book}


\setlength{\parindent}{2em}
\setlength{\parskip}{1em}
\renewcommand{\baselinestretch}{1.5}


\begin{document}


%
% Frontmatter
    \frontmatter
%   Titlepage
    \maketitle
%   Dedication
    \input{dedication}

    \input{summary}

%   Contents table
    \input{contents}

    \listoffigures
    \listoftables
% Mainmatter
    \mainmatter

    \pagestyle{plain}
    \input{intro}
    \input{chapter1}


    \appendix

% Backmatter
    \backmatter

    \bibliographystyle{apalike}
    \input{blibliography}


\end{document}
代码:
    \begin{figure}[H]
    \begin{subfigure}{.6\textwidth}
    \begin{tikzpicture}
    \begin{axis}[ line width=1,/pgf/number format/.cd,
    use period,
       grid=major, % Display a grid
       tick label style={font=\bfseries\large},
       label style={font=\bfseries\Large},
    grid style={gray!30},
    xlabel={Epochs},
    ylabel={rmse}]
    \addplot[color=red,smooth] table[x expr=\coordindex,y index=0] {
        1.1257
        0.992
        0.9681
        0.9579
        0.9521
        0.9485
        0.9457
        0.9445
        0.9432
        0.9424
        0.9413
        0.9409
        0.9409
        0.9408
        0.9402
        0.9397
        0.94
        0.9397
        0.9397
        0.9392
        0.9397
        0.9395
        0.9393
        0.9398
        0.9389
        0.9394
        0.9393
        0.9396
        0.9394
        0.9393
        0.9392
        0.939
        0.9389
        0.9394
        0.9393
        0.9385
        0.939
        0.9393
        0.9392
        0.9395
        0.9392
        0.9396
        0.9394
        0.9391
        0.9397
        0.9393
        0.9391
        0.9397
        0.9392
        0.9393
    };
    \addlegendentry{Validation Error}
    \addplot[color=blue,smooth] table[x expr=\coordindex,y index=0] {
        1.1257
        0.9836
        0.9558
        0.9431
        0.9359
        0.931
        0.9277
        0.9252
        0.9233
        0.9219
        0.9205
        0.9197
        0.9189
        0.9182
        0.9177
        0.9172
        0.9168
        0.9165
        0.9162
        0.9159
        0.9157
        0.9155
        0.9153
        0.9152
        0.915
        0.9149
        0.9147
        0.9146
        0.9145
        0.9143
        0.9143
        0.9142
        0.9141
        0.914
        0.914
        0.914
        0.9139
        0.9138
        0.9137
        0.9137
        0.9136
        0.9136
        0.9136
        0.9136
        0.9135
        0.9134
        0.9134
        0.9134
        0.9133
        0.9132
    };
    \addlegendentry{Train Error}
        \end{axis}
    \end{tikzpicture}
    \caption{RMSE  Movielens 100K}
    \label{fig:sub11}
\end{subfigure}%
\begin{subfigure}{.5\textwidth}
    \centering


    \begin{tikzpicture}
    \begin{axis}[line width=1,
    grid=major, % Display a grid
    grid style={gray!30},
     tick label style={font=\bfseries\large},
    label style={font=\bfseries\Large},
    xlabel={\textbf{Epochs}},
    ylabel={\textbf{rmse}}]
    \addplot[color=red,smooth] table[x expr=\coordindex,y index=0] {
        1.1171
        0.9495
        0.9254
        0.9157
        0.9105
        0.9073
        0.9052
        0.9037
        0.9026
        0.9019
        0.9012
        0.9008
        0.9005
        0.9
        0.8997
        0.8996
        0.8994
        0.8991
        0.899
        0.8989
        0.8988
        0.8988
        0.8987
        0.8987
        0.8985
        0.8985
        0.8984
        0.8984
        0.8983
        0.8983
        0.8983
        0.8983
        0.8982
        0.8982
        0.8981
        0.8982
        0.8981
        0.8981
        0.8981
        0.8981
        0.8981
        0.898
        0.898
        0.898
        0.898
        0.898
        0.898
        0.898
        0.898
        0.8981
    };
    \addlegendentry{Validation Error}
    \addplot[color=blue,smooth] table[x expr=\coordindex,y index=0] {
        1.1171
        0.953
        0.9303
        0.9217
        0.9171
        0.9144
        0.9126
        0.9114
        0.9105
        0.91
        0.9095
        0.9092
        0.9091
        0.9088
        0.9085
        0.9085
        0.9084
        0.9082
        0.9081
        0.9081
        0.9081
        0.9081
        0.9081
        0.908
        0.9079
        0.9079
        0.9079
        0.908
        0.9079
        0.9078
        0.908
        0.9079
        0.9078
        0.9078
        0.9078
        0.9079
        0.9079
        0.9078
        0.9079
        0.9079
        0.9078
        0.9079
        0.9078
        0.9080
        0.9079
        0.9078
        0.9079
        0.9079
        0.9079
        0.9080
    };
    \addlegendentry{Train Error}
    \end{axis}
    \end{tikzpicture}
    \caption{RMSE  Movielens 1M}
    \label{fig:sub22}
\end{subfigure}
\caption{.}
\label{}


\end{figure}
我正在使用的软件包:
 \usepackage[utf8]{inputenc}
 \usepackage[T1]{fontenc}
 \usepackage[english,spanish]{babel}
 \usepackage{graphicx}
 \usepackage{amsthm, amsmath, amssymb}
\usepackage{setspace}\onehalfspacing
\usepackage[loose,nice]{units}
\usepackage{DF-MSc-titlepage}
\usepackage{indentfirst}
\usepackage{lipsum}
\usepackage{aas_macros}
\usepackage{hyperref}
\usepackage{bookmark}
\usepackage{fancyhdr}


\usepackage{emptypage}
\usepackage[margin=1in]{geometry}
\usepackage{float}
\usepackage{multirow}
\usepackage{hhline}
%{m\usetikzlibraryatrix}
\usepackage{tikz}
\usepackage{array}
\usepackage{babel}
\usetikzlibrary{babel}
%% Change to another style
\usepackage{mathtools}
\newcommand{\MatrixVariable}[1]{\bm{\mathit{#1}}}
\usetikzlibrary{shapes,positioning}
%\usepackage[table]{xcolor}
\newcommand\myeq{\mathrel{\overset{\makebox[0pt]{\mbox{\normalfont\tiny\sffamily def}}}{=}}}
%\usepackage{minted}
\hypersetup{
    colorlinks=true,
    linkcolor=blue,
    filecolor=blue,
    urlcolor=blue,
    citecolor=blue
}
\usepackage{lipsum}
\usepackage{mwe}


\usepackage{subcaption}
\usepackage{epsfig}


%\usepackage[linesnumbered]{algorithm2e}
%\usepackage[linesnumbered,ruled]{algorithm2e}
\usepackage[spanish,ruled]{algorithm2e}

\usepackage{contour}
\contourlength{1pt}
\usetikzlibrary{tikzmark}
\usepackage{array}
\usetikzlibrary{positioning}
\newcommand*{\defeq}{\stackrel{\text{def}}{=}}
\usepackage{filecontents}
\usepackage{amsmath}
\usepackage{bm}
\usepackage{colortbl}
\usepackage{enumitem}
\usepackage{makecell}
\usepackage[font=footnotesize]{caption}
%\usepackage[nottoc]{tocbibind}
\usepackage{siunitx}
\usepackage{forest}
\usetikzlibrary{shadows,arrows.meta}
\usepackage{mathtools}
%\newcommand\myeq{\mathrel{\stackrel{\makebox[0pt]{\mbox{\normalfont\tiny def}}}{=}}}
\usepackage{graphicx}
\usepackage{pgfplots}
\pgfplotsset{compat=newest}
%\pgfplotsset{compat=1.16}
\usepackage{smartdiagram}
\smartdiagramset{border color=none,uniform color list=blue for all items}
%\usepackage{enumitem}
\usetikzlibrary{%
    arrows,%
    calc,%
    arrows.meta,
    fit,%
    patterns,%
    plotmarks,%
    shadows,
    shapes.geometric,%
    shapes.misc,%
    shapes.symbols,%
    shapes.arrows,%
    shapes.callouts,%
    shapes.multipart,%
    shapes.gates.logic.US,%
    shapes.gates.logic.IEC,%
    er,%
    automata,%
    backgrounds,%
    chains,%
    topaths,%
    trees,%
    petri,%
    mindmap,%
    matrix,%
    % calendar,%
    folding,%
    fadings,%
    through,%
    positioning,%
    scopes,%
    decorations.fractals,%
    decorations.shapes,%
    decorations.text,%
    decorations.pathmorphing,%
    decorations.pathreplacing,%
    decorations.footprints,%
    decorations.markings,%
    shadows}
\usetikzlibrary{arrows.meta,bending,positioning,calc}
\pgfkeyssetvalue{/cfr/soul base dimension}{5pt}
\usetikzlibrary{mindmap}
%\usepackage{amsmath}
%\usepackage{amssymb}
%\usepackage{bm}
\usepackage{mathtools}

%\usepackage[spanish,linesnumbered,inoutnumbered ,ruled]{algorithm2e} %for psuedo code

\usepackage{listings}
\usepackage{color}

\definecolor{codegreen}{rgb}{0,0.6,0}
\definecolor{codegray}{rgb}{0.5,0.5,0.5}
\definecolor{codepurple}{rgb}{0.58,0,0.82}
\definecolor{backcolour}{rgb}{0.95,0.95,0.92}

\lstdefinestyle{mystyle}{
    backgroundcolor=\color{backcolour},
    commentstyle=\color{codegreen},
    keywordstyle=\color{blue},
    numberstyle=\tiny\color{codegray},
    stringstyle=\color{codepurple},
    basicstyle=\footnotesize\ttfamily,
    breakatwhitespace=false,
    breaklines=true,
    captionpos=b,
    keepspaces=true,
    numbers=left,
    numbersep=5pt,
    showspaces=false,
    showstringspaces=false,
    showtabs=false,
    tabsize=2
}

\lstset{style=mystyle}


\graphicspath{{./figures/}}
%\usepackage[Sonny]{fncychap}
\renewcommand{\vec}[1]{\mathbf{#1}}

\geometry{bindingoffset=1cm}
\geometry{textwidth=390pt}
我正在使用的一些宏也是:
%
%  These Macros are taken from the AAS TeX macro package version 5.2
%  and are compatible with the macros in the A&A document class
%  version 7.0
%  Include this file in your LaTeX source only if you are not using
%  the AAS TeX macro package or the A&A document class and need to
%  resolve the macro definitions in the TeX/BibTeX entries returned by
%  the ADS abstract service.
%
%  If you plan not to use this file to resolve the journal macros
%  rather than the whole AAS TeX macro package, you should save the
%  file as ``aas_macros.sty'' and then include it in your LaTeX paper
%  by using a construct such as:
%   \documentstyle[11pt,aas_macros]{article}
%
%  For more information on the AASTeX and A&A packages, please see:
%       http://journals.aas.org/authors/aastex.html
%       ftp://ftp.edpsciences.org/pub/aa/readme.html
%  For more information about ADS abstract server, please see:
%       http://adsabs.harvard.edu/ads_abstracts.html
%

% Abbreviations for journals.  The object here is to provide authors
% with convenient shorthands for the most "popular" (often-cited)
% journals; the author can use these markup tags without being concerned
% about the exact form of the journal abbreviation, or its formatting.
% It is up to the keeper of the macros to make sure the macros expand
% to the proper text.  If macro package writers agree to all use the
% same TeX command name, authors only have to remember one thing, and
% the style file will take care of editorial preferences.  This also
% applies when a single journal decides to revamp its abbreviating
% scheme, as happened with the ApJ (Abt 1991).

\let\jnl@style=\rm
\def\ref@jnl#1{{\jnl@style#1}}

\def\aj{\ref@jnl{AJ}}                   % Astronomical Journal
\def\actaa{\ref@jnl{Acta Astron.}}      % Acta Astronomica
\def\araa{\ref@jnl{ARA\&A}}             % Annual Review of Astron and Astrophys
\def\apj{\ref@jnl{ApJ}}                 % Astrophysical Journal
\def\apjl{\ref@jnl{ApJ}}                % Astrophysical Journal, Letters
\def\apjs{\ref@jnl{ApJS}}               % Astrophysical Journal, Supplement
\def\ao{\ref@jnl{Appl.~Opt.}}           % Applied Optics
\def\apss{\ref@jnl{Ap\&SS}}             % Astrophysics and Space Science
\def\aap{\ref@jnl{A\&A}}                % Astronomy and Astrophysics
\def\aapr{\ref@jnl{A\&A~Rev.}}          % Astronomy and Astrophysics Reviews
\def\aaps{\ref@jnl{A\&AS}}              % Astronomy and Astrophysics, Supplement
\def\azh{\ref@jnl{AZh}}                 % Astronomicheskii Zhurnal
\def\baas{\ref@jnl{BAAS}}               % Bulletin of the AAS
\def\bac{\ref@jnl{Bull. astr. Inst. Czechosl.}}
                % Bulletin of the Astronomical Institutes of Czechoslovakia
\def\caa{\ref@jnl{Chinese Astron. Astrophys.}}
                % Chinese Astronomy and Astrophysics
\def\cjaa{\ref@jnl{Chinese J. Astron. Astrophys.}}
                % Chinese Journal of Astronomy and Astrophysics
\def\icarus{\ref@jnl{Icarus}}           % Icarus
\def\jcap{\ref@jnl{J. Cosmology Astropart. Phys.}}
                % Journal of Cosmology and Astroparticle Physics
\def\jrasc{\ref@jnl{JRASC}}             % Journal of the RAS of Canada
\def\memras{\ref@jnl{MmRAS}}            % Memoirs of the RAS
\def\mnras{\ref@jnl{MNRAS}}             % Monthly Notices of the RAS
\def\na{\ref@jnl{New A}}                % New Astronomy
\def\nar{\ref@jnl{New A Rev.}}          % New Astronomy Review
\def\pra{\ref@jnl{Phys.~Rev.~A}}        % Physical Review A: General Physics
\def\prb{\ref@jnl{Phys.~Rev.~B}}        % Physical Review B: Solid State
\def\prc{\ref@jnl{Phys.~Rev.~C}}        % Physical Review C
\def\prd{\ref@jnl{Phys.~Rev.~D}}        % Physical Review D
\def\pre{\ref@jnl{Phys.~Rev.~E}}        % Physical Review E
\def\prl{\ref@jnl{Phys.~Rev.~Lett.}}    % Physical Review Letters
\def\pasa{\ref@jnl{PASA}}               % Publications of the Astron. Soc. of Australia
\def\pasp{\ref@jnl{PASP}}               % Publications of the ASP
\def\pasj{\ref@jnl{PASJ}}               % Publications of the ASJ
\def\rmxaa{\ref@jnl{Rev. Mexicana Astron. Astrofis.}}%
                % Revista Mexicana de Astronomia y Astrofisica
\def\qjras{\ref@jnl{QJRAS}}             % Quarterly Journal of the RAS
\def\skytel{\ref@jnl{S\&T}}             % Sky and Telescope
\def\solphys{\ref@jnl{Sol.~Phys.}}      % Solar Physics
\def\sovast{\ref@jnl{Soviet~Ast.}}      % Soviet Astronomy
\def\ssr{\ref@jnl{Space~Sci.~Rev.}}     % Space Science Reviews
\def\zap{\ref@jnl{ZAp}}                 % Zeitschrift fuer Astrophysik
\def\nat{\ref@jnl{Nature}}              % Nature
\def\iaucirc{\ref@jnl{IAU~Circ.}}       % IAU Cirulars
\def\aplett{\ref@jnl{Astrophys.~Lett.}} % Astrophysics Letters
\def\apspr{\ref@jnl{Astrophys.~Space~Phys.~Res.}}
                % Astrophysics Space Physics Research
\def\bain{\ref@jnl{Bull.~Astron.~Inst.~Netherlands}}
                % Bulletin Astronomical Institute of the Netherlands
\def\fcp{\ref@jnl{Fund.~Cosmic~Phys.}}  % Fundamental Cosmic Physics
\def\gca{\ref@jnl{Geochim.~Cosmochim.~Acta}}   % Geochimica Cosmochimica Acta
\def\grl{\ref@jnl{Geophys.~Res.~Lett.}} % Geophysics Research Letters
\def\jcp{\ref@jnl{J.~Chem.~Phys.}}      % Journal of Chemical Physics
\def\jgr{\ref@jnl{J.~Geophys.~Res.}}    % Journal of Geophysics Research
\def\jqsrt{\ref@jnl{J.~Quant.~Spec.~Radiat.~Transf.}}
                % Journal of Quantitiative Spectroscopy and Radiative Transfer
\def\memsai{\ref@jnl{Mem.~Soc.~Astron.~Italiana}}
                % Mem. Societa Astronomica Italiana
\def\nphysa{\ref@jnl{Nucl.~Phys.~A}}   % Nuclear Physics A
\def\physrep{\ref@jnl{Phys.~Rep.}}   % Physics Reports
\def\physscr{\ref@jnl{Phys.~Scr}}   % Physica Scripta
\def\planss{\ref@jnl{Planet.~Space~Sci.}}   % Planetary Space Science
\def\procspie{\ref@jnl{Proc.~SPIE}}   % Proceedings of the SPIE

\let\astap=\aap
\let\apjlett=\apjl
\let\apjsupp=\apjs
\let\applopt=\ao
答案1
正如对您的问题和答案的评论:
请始终提供 MWE(Minimal WorkingExample),这是一个小但完整的文档,它可以重现您的问题,在您的情况下它可以如下所示:
\documentclass[11pt,a4paper,twoside,openright]{book}
\usepackage[spanish]{babel}
\usepackage{pgfplots}
\pgfplotsset{compat=1.16}

\begin{document}
    \begin{tikzpicture}
    \begin{axis}[line width=1,/pgf/number format/.cd, use period,
       grid=major, % Display a grid
       tick label style={font=\bfseries\large},
       label style={font=\bfseries\Large},
        grid style={gray!30},
        xlabel={Epochs},
        ylabel={rmse}]
    \addplot[color=red,smooth] table[x expr=\coordindex,y index=0] {
        1.1257
        0.992
        0.9681
        0.9579
        0.9521
        0.9485
        0.9457
        0.9445
        0.9432
        0.9424
        0.9413
        0.9409
        0.9409
        0.9408
        0.9402
        0.9397
        0.94
        0.9397
        0.9397
        0.9392
        0.9397
        0.9395
        0.9393
        0.9398
        0.9389
        0.9394
        0.9393
        0.9396
        0.9394
        0.9393
        0.9392
        0.939
        0.9389
        0.9394
        0.9393
        0.9385
        0.939
        0.9393
        0.9392
        0.9395
        0.9392
        0.9396
        0.9394
        0.9391
        0.9397
        0.9393
        0.9391
        0.9397
        0.9392
        0.9393
    };
        \end{axis}
    \end{tikzpicture}
\end{document}
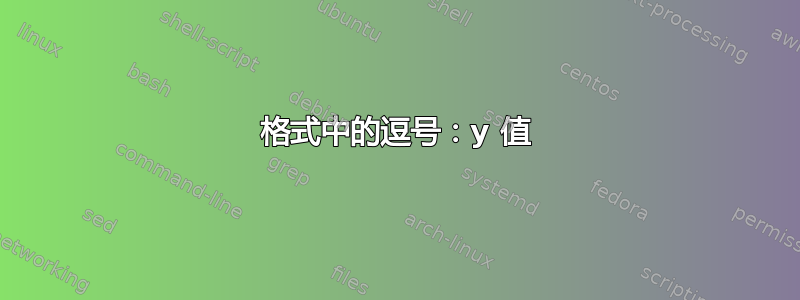
并给出:

另外,解决方案最好添加 MWE,这样可以测试其工作原理。例如:
... 问题是西班牙语
babel,默认情况下将小数点更改为小数点逗号。这可以通过不同的方式更改。其中之一是选择不同的符号\spanishdecimal{<symbol>},例如通过添加:\tikzset{ every picture/.prefix style={ execute at begin picture=\spanishdecimal{.}} % <--- solve the problem }在文档序言中。完整的 MWE 为:
\documentclass[11pt,a4paper,twoside,openright]{book}
\usepackage[spanish]{babel}
\usepackage{pgfplots}
\pgfplotsset{compat=1.16}  % not use `newest`,
                           % you will lost information with which version MWE was tested

\tikzset{
  every picture/.prefix style={
    execute at begin picture=\spanishdecimal{.}}    % <--- solve the problem
        }

\begin{document}
    \begin{tikzpicture}
    \begin{axis}[line width=1, % /pgf/number format/.cd, use period,
       grid=major, % Display a grid
       tick label style={font=\bfseries\large},
       label style={font=\bfseries\Large},
        grid style={gray!30},
        xlabel={Epochs},
        ylabel={rmse}]
    \addplot[color=red,smooth] table[x expr=\coordindex,y index=0] {
        1.1257
        0.992
        0.9681
        0.9579
        0.9521
        0.9485
        0.9457
        0.9445
        0.9432
        0.9424
        0.9413
        0.9409
        0.9409
        0.9408
        0.9402
        0.9397
        0.94
        0.9397
        0.9397
        0.9392
        0.9397
        0.9395
        0.9393
        0.9398
        0.9389
        0.9394
        0.9393
        0.9396
        0.9394
        0.9393
        0.9392
        0.939
        0.9389
        0.9394
        0.9393
        0.9385
        0.939
        0.9393
        0.9392
        0.9395
        0.9392
        0.9396
        0.9394
        0.9391
        0.9397
        0.9393
        0.9391
        0.9397
        0.9392
        0.9393
    };
        \end{axis}
    \end{tikzpicture}

\end{document}
这使:

- 您真的需要文档序言中列出的所有软件包和库吗?如果不是,请删除所有未使用的软件包和库。它们只会压垮文档代码和编译过程。
hypperref除极少数情况外(例如在包之前),该包应最后加载cleveref。
答案2
我能够修复它!我添加了它\decimalpoint并且它起作用了。默认情况下,西班牙语将逗号更改为小数分隔符;要更改为点,我使用了 \decimalpoint。这样就可以随时恢复为逗号,使用\decimalcomma或 甚至可以选择不同的符号\spanishdecimal{<symbol>}。我将 \decimalpoint 命令放在包文件中。