

各位同仁,大家好!
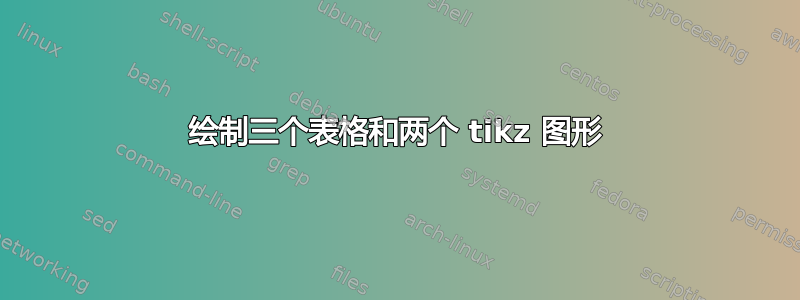
我需要完成图片上的内容:

或多或少的 MWE:
\documentclass[tikz,border=2.14mm]{standalone}
\usetikzlibrary{fit,positioning,decorations.pathreplacing}

\begin{document}
    \begin{tikzpicture}[font=\small,
     standard/.style={inner sep=0pt,align=center,draw,text  height=1.25em,text depth=0.5em}]

    \node[fill=black!20,yshift=1cm,standard] (Trd)  {Training Set };
    \node[right=0.5em of Trd,standard,fill=blue!50,text width=4cm] (Ted)  {Test Set};
    \node[fit=(Trd) (Ted),fill=white!30,yshift=1cm,standard] (Ald)  {Original Set};
    \draw[thick,decorate] ([yshift=-3pt]north east) -- ([yshift=3pt]south east)
    node[midway,right]{};
    \node[anchor=north east,standard,text width=4cm,fill=white] at
    (south-|Ted.west) (Trd) {Training Set -  Validation Set};
    \node[anchor=north west,standard,text width=4cm,fill=white] at
    (south-|Ted.west) (Ted2) {Test set};


    \end{tikzpicture}
\end{document}
答案1

\documentclass[tikz,border=3mm]{standalone}
\usetikzlibrary{arrows.meta,
                bending,
                calc,
                decorations.pathreplacing,
                positioning,
                shadows,
                shapes.symbols}

\begin{document}
    \begin{tikzpicture}[
 node distance = 2mm and 0mm,
    box/.style = {draw, semithick, fill= gray!30,
                  minimum width=#1, minimum height=4ex, align=center,
                  text width=#1-2*\pgfkeysvalueof{/pgf/inner xsep},
                  outer xsep=0pt, drop shadow},
   sbox/.style = {signal, draw=cyan, semithick, fill=cyan!30,
                  signal to=east and west,
                  text width=#1, align=center, inner xsep=-3pt,
                  drop shadow},
    arr/.style = {line width=1mm, gray, -{Triangle[angle=60:3pt 2,flex]}}
                        ]
\node (a11) [box=54mm]                  {Training set};
\node (a12) [box=27mm, right=of a11]    {Validation set};
\node (a13) [box=27mm, right=of a12]    {Test set};
%
\path   let \p1 = ($(a11.west)-(a12.east)$),
            \n1 = {veclen(\x1,\y1)} in
        node (a21)  [box=\n1, above=of $(a11.north west)!0.5!(a12.north east)$]
                    {Training Set};
\node (a22) [box=27mm, right=of a21]    {Validation set};
%
\path   let \p1 = ($(a21.west)-(a22.east)$),
            \n1 = {veclen(\x1,\y1)} in
        node (a31)  [box=\n1, above=of $(a21.north west)!0.5!(a22.north east)$]
                    {Original Set};
%
\node (b1)  [sbox=28mm, below=12mm of a11]    {Machine learning algorithm};
\node (b2)  [box=24mm, rounded corners, fill=olive!30,
             below=5mm of b1]           {Predictive Model};
%
\node [below=of a11.south east,font=\footnotesize, align=left]
      {Training, tuning\\ and evaluation};
\draw[arr]  (b1.east) ++ (2mm,3mm) arc(150:-150:7mm);
%
\draw[arr]  (a11) -- (b1);
\draw[arr]  (b1)  -- (b2);
\draw[arr]  (a12) |- ([yshift= 2mm] b2.east);
\draw[arr]  (a13) |- ([yshift=-2mm] b2.east);
    \end{tikzpicture}
\end{document}
笔记: 当我绘制 TikZ 图片时,我会按如下方式进行操作:
- 识别图像节点中使用的所有形状,然后在 TikZ 和 PGF 手册中搜索绘制它们所需的库。
- 定义节点样式(通过此图像代码更短,简洁,更清晰)。
- 决定如何绘制图像(使用绝对或相对/首选/坐标来放置节点,使用哪个节点开始绘制图像等)。
- 定义连接线样式。
- 放置节点。
- 在节点之间画线。
答案2
另一个建议,可能更接近您的屏幕截图。此外,它不需要任何 calc 语法,而是使用与您可能已经standard从。
\documentclass[tikz,border=3.14mm]{standalone}
\usetikzlibrary{fit,positioning,decorations.pathreplacing,shadows.blur,shapes.misc,decorations.pathreplacing,
arrows.meta,bending}

\begin{document}
    \begin{tikzpicture}[font=\small\sffamily,
     standard/.style={fill=gray!10,inner sep=0pt,align=center,blur shadow,
     draw,text  height=1.25em,text depth=0.5em},
     shadowed/.style={decorate,decoration={
       show path construction,lineto code={
        \draw[#1,gray,opacity=0.5] ([xshift=0.5ex,yshift=-0.25ex]\tikzinputsegmentfirst) -- ([xshift=0.5ex,yshift=-0.25ex]\tikzinputsegmentlast);
        \draw[#1] (\tikzinputsegmentfirst) -- (\tikzinputsegmentlast);
        },curveto code={
        \draw[#1,gray,opacity=0.5]
        ([xshift=0.5ex,yshift=-0.25ex]\tikzinputsegmentfirst) .. controls
        ([xshift=0.5ex,yshift=-0.25ex]\tikzinputsegmentsupporta)
        and ([xshift=0.5ex,yshift=-0.25ex]\tikzinputsegmentsupportb)
        ..([xshift=0.5ex,yshift=-0.25ex]\tikzinputsegmentlast);
        \draw[#1] (\tikzinputsegmentfirst) .. controls
        (\tikzinputsegmentsupporta) and (\tikzinputsegmentsupportb)
        ..(\tikzinputsegmentlast);
        }}}]

    \node[standard,text width=12em] (BL)  {Training Set };
    \node[right=0em of BL,standard,inner xsep=0.5em,densely dashed] (B)  {Validation set};
    \node[right=0em of B,standard,text width=4em] (BR)  {Test set};
    \node[fit=(BL) (B),yshift=3em,standard] (L)  {Training Set};
    \node[right=0em of L,standard,text width=4em] (R)  {Test set};
    \node[fit=(L) (R),yshift=3em,standard] (L)  {Original Set};
    \node[below=3em of BL,chamfered rectangle,chamfered rectangle xsep=1.5cm,
    align=center,draw=blue!50,fill=blue!15,thick,blur shadow] (ML)
    {machine learning\\ algorithm};
    \node[anchor=south west,align=left,inner xsep=0.6em] at (ML.north) {Training, tuning, and\\
     evaluation};
    \node[below=3em of ML,rounded corners=2pt,draw=blue!50,fill=blue!15,
    thick,blur shadow] (PM) {Predictive model};
    \draw[shadowed={-Latex,thick}] (BL) -- (ML);
    \draw[shadowed={-Latex,thick}] (ML) -- (PM);
    \draw[shadowed={Latex-,thick}] (PM.30) -- ++ (0,1em) coordinate(aux);
    \draw[shadowed={-,thick}] (aux)-| (B);
    \draw[shadowed={Latex-,thick}] (PM.east) -- (PM.east-|BR);
    \draw[shadowed={-,thick}] (PM.east-|BR) -- (BR);
    \draw[shadowed={-{Latex[bend,length=6pt]},gray,line width=0.5ex}] ([xshift=0.3em,yshift=0.1em]ML.east)
    arc(190:370:1.5em) coordinate(aux0);
    \draw[shadowed={-{Latex[bend,length=6pt]},gray,line width=0.5ex}] ([yshift=0.1em]aux0)
    arc(10:190:1.5em);
    \end{tikzpicture}
\end{document}
