

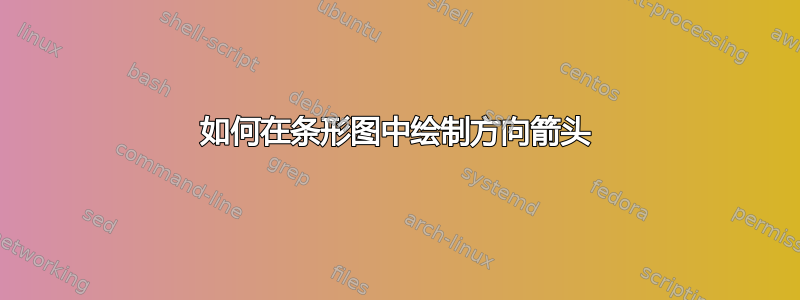
我制作了一个条形图,其中两个组各有两个条形。下面是我的 MWE。我一直在努力弄清楚如何在第 1 代组的蓝色条形和红色条形之间绘制一个向上的箭头,以及在第 2 代组的蓝色条形和红色条形之间绘制一个向下的箭头。
如果有人能帮忙那将非常有帮助。
\begin{figure}
    \centering
    \begin{tikzpicture}
\begin{axis}[
    ybar, bar width=23pt,
    ymajorgrids=true,
    grid style=dashed,
    enlarge x limits=0.4,
    % legend style={at={(1.2, 0.5), \footnotesize},
    %   anchor=west,legend columns=1.8},
    legend style={anchor=north east,legend columns=1.8,font=\footnotesize},
    ylabel={\% of the total ML-identifable mixed clauses},
    symbolic x coords={Gen1, Gen2},
    xtick=data,
    ymin=0,
    ymax=100,
    ytick={10,30,50,70,90},
    nodes near coords,
    point meta=explicit symbolic
    ]
\addplot coordinates {(Gen1,22)[{141}] (Gen2,53)[{273}]};
\addplot coordinates {(Gen1,78)[{510}] (Gen2,47)[{242}]};
\legend{E ML, V ML}
\end{axis}
\end{tikzpicture}
    \caption{Opposite distribution}
    \label{fg:MLdistribution}
\end{figure}
答案1
您可以命名坐标附近的节点并使用它们。
\documentclass{article}
\usepackage{pgfplots}
\pgfplotsset{compat=1.16}
\pgfplotsset{% https://tex.stackexchange.com/a/75811/194703
    name nodes near coords/.style={
        every node near coord/.append style={
            name=#1-\coordindex,
            alias=#1-last,
        },
    },
    name nodes near coords/.default=coordnode
}
\begin{document}

\begin{figure}
    \centering
    \begin{tikzpicture}
\begin{axis}[
    ybar, bar width=23pt,
    ymajorgrids=true,
    grid style=dashed,
    enlarge x limits=0.4,
    % legend style={at={(1.2, 0.5), \footnotesize},
    %   anchor=west,legend columns=1.8},
    legend style={anchor=north east,legend columns=1.8,font=\footnotesize},
    ylabel={\% of the total ML-identifable mixed clauses},
    symbolic x coords={Gen1, Gen2},
    xtick=data,
    ymin=0,
    ymax=100,
    ytick={10,30,50,70,90},
    nodes near coords,
    point meta=explicit symbolic
    ]
\addplot+[name nodes near coords=bn] coordinates {(Gen1,22)[{141}] (Gen2,53)[{273}]};
\addplot+[name nodes near coords=rn] coordinates {(Gen1,78)[{510}] (Gen2,47)[{242}]};
\legend{E ML, V ML}
\end{axis}
\draw[thick,-latex] (bn-0.north) -- (rn-0.south);
\draw[thick,-latex] (bn-1.east) -- (rn-1.north);
\end{tikzpicture}
\caption{Opposite distribution}
\label{fg:MLdistribution}
\end{figure}
\end{document}
