

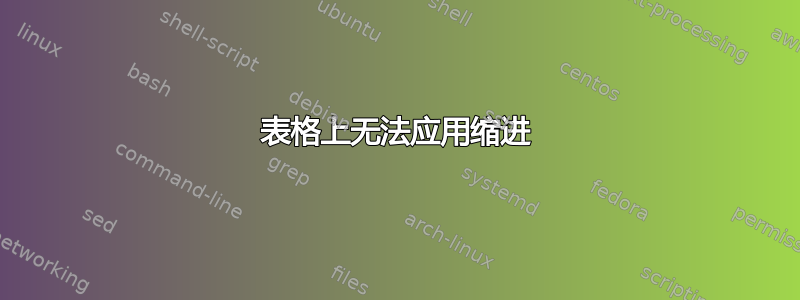
我想对齐此表格的列,但是使用以下代码无法做到。
\bigskip
\centerline {\large \textbf{Behaviour of A* on a 5x5 grid}}
\bigskip
\noindent \begin{tabularx}{\linewidth}{
& \includegraphics[height=1in]{astar1.png}
& \includegraphics[height=1in]{astar2.png}
& \includegraphics[height=1in]{astar3.png}
& \includegraphics[height=1in]{astar4.png}
& \includegraphics[height=1in]{astar5-3.png}    \\ \\
& \includegraphics[height=1in]{astar6.png}
& \includegraphics[height=1in]{astar7.png}
& \includegraphics[height=1in]{astar9.png}
& \includegraphics[height=1in]{astar10.png}
& \includegraphics[height=1in]{astar11.png}    \\ \\
& \includegraphics[height=1in]{astar12.png}
& \includegraphics[height=1in]{astar13.png}
& \includegraphics[height=1in]{astar14.png}
\end{tabularx}
我得到的输出如下,在第一行之前有一点水平间距。

编辑!!!:

\documentclass[a4paper]{article}
\usepackage{fullpage}
\usepackage{amsmath}
\usepackage{amssymb}
\usepackage{graphicx}
\usepackage{physics}
%\usepackage[round]{natbib}
%\usepackage{bibtex}
\usepackage{fancyvrb}
\usepackage{hyperref}
\usepackage[linesnumbered,boxed]{algorithm2e}
\usepackage{subfigure}
\usepackage{xcolor}
\usepackage{varwidth}
\usepackage{cleveref} % Used
\usepackage{hvfloat} % Used for an image with caption
\usepackage{amsthm}

\usepackage{listings}
\usepackage{xcolor}

\definecolor{codegreen}{rgb}{0,0.6,0}
\definecolor{codegray}{rgb}{0.5,0.5,0.5}
\definecolor{codepurple}{rgb}{0.75,0,0.82}
\definecolor{backcolour}{rgb}{0.95,0.95,0.92}

\lstdefinestyle{mystyle}{
    backgroundcolor=\color{backcolour},
    commentstyle=\color{codegreen},
    keywordstyle=\color{codepurple},
    numberstyle=\tiny\color{codegray},
    stringstyle=\color{codepurple},
    basicstyle=\ttfamily\footnotesize,
    breakatwhitespace=false,
    breaklines=true,
    captionpos=b,
    keepspaces=true,
    numbers=left,
    numbersep=5pt,
    showspaces=false,
    showstringspaces=false,
    showtabs=false,
    tabsize=2
}

\lstset{style=mystyle}

\numberwithin{equation}{section} % Remove this line for global equation numbering
\definecolor{antiquefuchsia}{rgb}{0.57, 0.36, 0.51}
\definecolor{azure(colorwheel)}{rgb}{0.0, 0.5, 1.0}
答案1
这是一个没有任何的替代方案tabular:

\documentclass[a4paper]{article}

\usepackage{graphicx}
\usepackage{bm}


\begin{document}

\begin{center}
  {\large\bfseries Behaviour of $\bm{A^*}$ on a $\bm{5 \times 5}$ grid\par}
  \bigskip
\includegraphics[width=0.9in]{example-image}  \hfill
\includegraphics[width=0.9in]{example-image}  \hfill
\includegraphics[width=0.9in]{example-image}  \hfill
\includegraphics[width=0.9in]{example-image}  \hfill
\includegraphics[width=0.9in]{example-image}  \hfill
\includegraphics[width=0.9in]{example-image}  \hfill
\includegraphics[width=0.9in]{example-image}  \hfill
\includegraphics[width=0.9in]{example-image}  \hfill
\includegraphics[width=0.9in]{example-image}  \hfill
\includegraphics[width=0.9in]{example-image}  \hfill
\includegraphics[width=0.9in]{example-image}  \hfill
\includegraphics[width=0.9in]{example-image}  \hfill
\includegraphics[width=0.9in]{example-image}  \hfill
\phantom{\includegraphics[width=0.9in]{example-image}}  \hfill
\phantom{\includegraphics[width=0.9in]{example-image}}  \hfill
\end{center}

\end{document}
行与行之间有一定的垂直距离:

\documentclass[a4paper]{article}

\usepackage{graphicx}
\usepackage{bm}


\begin{document}

\begin{center}
  {\large\bfseries Behaviour of $\bm{A^*}$ on a $\bm{5 \times 5}$ grid\par}
  \bigskip
\includegraphics[width=0.9in]{example-image}  \hfill
\includegraphics[width=0.9in]{example-image}  \hfill
\includegraphics[width=0.9in]{example-image}  \hfill
\includegraphics[width=0.9in]{example-image}  \hfill
\includegraphics[width=0.9in]{example-image}
\medskip

\includegraphics[width=0.9in]{example-image}  \hfill
\includegraphics[width=0.9in]{example-image}  \hfill
\includegraphics[width=0.9in]{example-image}  \hfill
\includegraphics[width=0.9in]{example-image}  \hfill
\includegraphics[width=0.9in]{example-image}
\medskip

\includegraphics[width=0.9in]{example-image}  \hfill
\includegraphics[width=0.9in]{example-image}  \hfill
\includegraphics[width=0.9in]{example-image}  \hfill
\phantom{\includegraphics[width=0.9in]{example-image}}  \hfill
\phantom{\includegraphics[width=0.9in]{example-image}}  \hfill
\end{center}

\end{document}
答案2
你的论据供给tabularx缺少列规范。下面我使用CentredX列来纠正这个问题:

\documentclass{article}

\usepackage[margin=1in]{geometry}% Just for this example
\usepackage{tabularx,graphicx,bm}

\newcolumntype{C}{>{\centering\arraybackslash}X}
\begin{document}

\begin{center}
  {\large\bfseries Behaviour of $\bm{A^*}$ on a $\bm{5 \times 5}$ grid\par}
  \bigskip
  \begin{tabularx}{\linewidth}{ @{} C C C C C @{} }
    \includegraphics[width=1in]{example-image} &
      \includegraphics[width=1in]{example-image} &
      \includegraphics[width=1in]{example-image} &
      \includegraphics[width=1in]{example-image} &
      \includegraphics[width=1in]{example-image} \\ \\
    \includegraphics[width=1in]{example-image} &
      \includegraphics[width=1in]{example-image} &
      \includegraphics[width=1in]{example-image} &
      \includegraphics[width=1in]{example-image} &
      \includegraphics[width=1in]{example-image} \\ \\
    \includegraphics[width=1in]{example-image} &
      \includegraphics[width=1in]{example-image} &
      \includegraphics[width=1in]{example-image}
  \end{tabularx}
\end{center}

\end{document}
showframe您可以通过在加载中添加选项来查看网格如何适应页面尺寸geometry(仅为本例加载):

答案3
另一种可能性是tabular*:
\documentclass{article}
\usepackage[ demo]{graphicx}
\usepackage{showframe}%
\renewcommand{\ShowFrameLinethickness}{0.3pt}

\begin{document}

{\centering \begin{tabular*}{\linewidth} {@{\extracolsep{\fill}}ccccc@{}}
\multicolumn{5}{c}{\bfseries\large\centering Behaviour of A* on a 5x5 grid}\\\\
 \includegraphics[height=1in, width=0.75in]{astar1.png}
& \includegraphics[height=1in, width=0.75in]{astar2.png}
 & \includegraphics[height=1in, width=0.75in]{astar3.png}
& \includegraphics[height=1in, width=0.75in]{astar4.png}
&\includegraphics[height=1in, width=0.75in]{astar5-3.png} \tabularnewline \\
 \includegraphics[height=1in, width=0.75in]{astar6.png}
& \includegraphics[height=1in, width=0.75in]{astar7.png}
& \includegraphics[height=1in, width=0.75in]{astar9.png}
& \includegraphics[height=1in, width=0.75in]{astar10.png} \\ \\
 \includegraphics[height=1in, width=0.75in]{astar12.png}
& \includegraphics[height=1in, width=0.75in]{astar13.png}
& \includegraphics[height=1in, width=0.75in]{astar14.png}
\end{tabular*}}

\end{document}

答案4
以下是如何设置行和列之间的等距。最后一行的位置可以通过指定\centering或 来更改\raggedright。
\documentclass[a4paper]{article}

\usepackage{graphicx}
\usepackage{caption}

\captionsetup[table]{labelformat=empty}
\newlength{\gridwidth}
\newlength{\gridsep}

\begin{document}

\begin{table}[htp]

\caption{Behaviour of $A^*$ on a $5 \times 5$ grid}

\setlength{\gridsep}{1ex}% or whatever
\setlength{\lineskip}{\gridsep}% space between rows
\setlength{\gridwidth}{0.2\dimexpr(\textwidth-4\gridsep)}% space between cols
\newcommand{\sep}{\hspace{\gridsep}}

\raggedright

\includegraphics[width=\gridwidth]{example-image}\sep
\includegraphics[width=\gridwidth]{example-image}\sep
\includegraphics[width=\gridwidth]{example-image}\sep
\includegraphics[width=\gridwidth]{example-image}\sep
\includegraphics[width=\gridwidth]{example-image}\sep
\includegraphics[width=\gridwidth]{example-image}\sep
\includegraphics[width=\gridwidth]{example-image}\sep
\includegraphics[width=\gridwidth]{example-image}\sep
\includegraphics[width=\gridwidth]{example-image}\sep
\includegraphics[width=\gridwidth]{example-image}\sep
\includegraphics[width=\gridwidth]{example-image}\sep
\includegraphics[width=\gridwidth]{example-image}\sep
\includegraphics[width=\gridwidth]{example-image}

\end{table}

\begin{table}[htp]

\caption{Behaviour of $A^*$ on a $5 \times 5$ grid}

\setlength{\gridsep}{2ex}% or whatever
\setlength{\lineskip}{\gridsep}% space between rows
\setlength{\gridwidth}{0.2\dimexpr(\textwidth-4\gridsep)}% space between cols
\newcommand{\sep}{\hspace{\gridsep}}

\centering

\includegraphics[width=\gridwidth]{example-image}\sep
\includegraphics[width=\gridwidth]{example-image}\sep
\includegraphics[width=\gridwidth]{example-image}\sep
\includegraphics[width=\gridwidth]{example-image}\sep
\includegraphics[width=\gridwidth]{example-image}\sep
\includegraphics[width=\gridwidth]{example-image}\sep
\includegraphics[width=\gridwidth]{example-image}\sep
\includegraphics[width=\gridwidth]{example-image}\sep
\includegraphics[width=\gridwidth]{example-image}\sep
\includegraphics[width=\gridwidth]{example-image}\sep
\includegraphics[width=\gridwidth]{example-image}\sep
\includegraphics[width=\gridwidth]{example-image}\sep
\includegraphics[width=\gridwidth]{example-image}

\end{table}

\end{document}
