

我正在尝试使用 pgfplots 绘制下图:
\begin{equation*}
\begin{tikzpicture}
    \begin{axis}[
    axis lines=middle,
    axis line style={latex-latex},
    xmin=-5,ymin=-1,xmax=5,ymax=2,
    samples=100,
    grid=major,
    xlabel={\(x\)},
    ylabel={\(ReLU(x) = max(0,x)\)},
    title={Rectified Linear Unit Function}]
\addplot[black, thick]{max(0,x)};
\end{axis}
\end{tikzpicture}
\end{equation*}
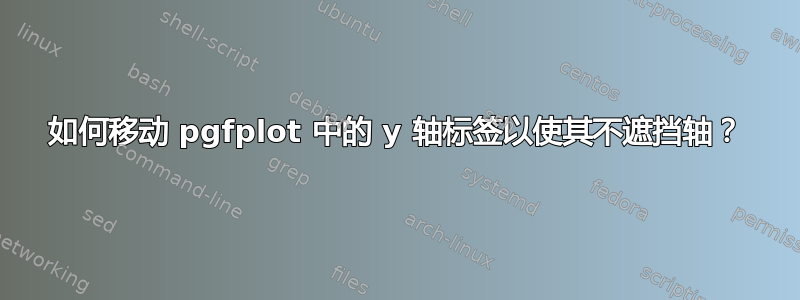
看起来像这样:

有什么方法可以将 y 轴标签移到轴的左侧,这样它就不会遮挡图形吗?我知道我可以把它放在轴的末端,但它会遮挡标题。
答案1
ylabel欢迎!您可以使用键控制的外观ylabel style。
\documentclass{article}
\usepackage{amsmath}
\DeclareMathOperator{\re}{Re}
\usepackage{pgfplots}
\pgfplotsset{compat=1.16}
\begin{document}
\begin{equation*}
\begin{tikzpicture}
    \begin{axis}[
    axis lines=middle,
    axis line style={latex-latex},
    xmin=-5,ymin=-1,xmax=5,ymax=2,
    samples=100,
    grid=major,
    xlabel={\(x\)},
    ylabel={\(\re LU(x) = \max(0,x)\)},
    ylabel style={yshift=-0.5ex,anchor=north east},
    title={Rectified Linear Unit Function}]
\addplot[black, thick,samples at={-5,0,5}]{max(0,x)};
\end{axis}
\end{tikzpicture}
\end{equation*}
\end{document}

我不知道将图放在环境中是否是个好主意equation*,但我暂时保留了它,但我确实认为使用\max和\re作为相应的数学运算符是个好主意。我也用它samples at={-5,0,5}来更公正地执行max函数。
不过,您可能想要删除 处的刻度标签y=2。
\documentclass{article}
\usepackage{amsmath}
\DeclareMathOperator{\re}{Re}
\usepackage{pgfplots}
\pgfplotsset{compat=1.16}
\begin{document}
\begin{tikzpicture}
    \begin{axis}[
    axis lines=middle,
    axis line style={latex-latex},
    xmin=-5,ymin=-1,xmax=5,ymax=2,
    ytick={1},
    samples=100,
    grid=major,
    xlabel={\(x\)},
    ylabel={\(\re LU(x) = \max(0,x)\)},
    ylabel style={yshift=-0.5ex,anchor=east},
    title={Rectified Linear Unit Function}]
\addplot[black, thick,samples at={-5,0,5}]{max(0,x)};
\end{axis}
\end{tikzpicture}
\end{document}
