

在下面给出的代码中,我尝试生成不同的编程语言语法环境。使用当前代码,我无法使输出以彩色突出显示的语法和背景颜色显示。此外,不同编程代码的命名无法正确显示。对于 Matlab 代码,标题应显示“Matlab 代码 1:一些 Matlab 代码”。对于 Python 代码,标题应显示“Python 代码 1:一些 Python 代码。数字应根据所呈现的代码而增加。
我希望获得一些帮助,使颜色能够在不同的编程语言环境中正确显示,并且使编号在不同的编程语言中递增。
非常感谢任何指导和帮助!谢谢!
代码
\documentclass[a4paper, 10pt, oneside, fleqn, openright]{report}
\usepackage[no-math]{fontspec}

\usepackage{calc}
\usepackage[usenames,dvipsnames,svgnames,table]{xcolor}
\usepackage{pdfpages,graphicx}
\usepackage{mdframed}
\usepackage{listings}
\definecolor{light-gray}{gray}{0.92}

\definecolor{mainColor}{RGB}{211, 47, 47} % some dark red

\usepackage[numbered,framed]{matlab-prettifier}

\renewcommand\lstlistingname{Python Code}
\lstdefinestyle{pycode}{
    language=Python,
    numbers=left,
    numbersep= 7mm,
    numberstyle=\color{Black},
    stepnumber=1,
    tabsize=3,
    breakatwhitespace=false,
    breaklines=true,
    captionpos=b,
    basicstyle=\color{Black}\ttfamily,
    commentstyle=\color{LimeGreen},
    keywordstyle=\color{BurntOrange}\bfseries,
    stringstyle=\color{WildStrawberry},
    keywords={var, func, extends, import},
    frame=leftline,
    framesep=0mm,
    xleftmargin=3mm,
    framesep=2mm,
    framerule=0mm,
    abovecaptionskip=5mm,
    aboveskip=\baselineskip,
    belowskip=\baselineskip
}

\lstdefinestyle{mcode}{
    style = {Matlab-editor},
    numbers=left,
    numbersep= 7mm,
    numberstyle=\color{Gray!80}\scriptsize,
    stepnumber=1,
    tabsize=3,
    breakatwhitespace=false,
    breaklines=true,
    captionpos=b,
    frame=leftline,
    framesep=0mm,
    xleftmargin=3mm,
    framesep=2mm,
    framerule=0mm,
    abovecaptionskip=5mm,
    aboveskip=\baselineskip,
    belowskip=\baselineskip,
    backgroundcolor=\color{myblueiii},
    basicstyle=\ttfamily\scriptsize,
}

%\lstnewenvironment{myPyCode}
%{\lstset{style=pycode}}
%{}
%
%\lstnewenvironment{myMatCode}
%{\lstset{style=mcode}}
%{}

\usepackage{tcolorbox}
\tcbuselibrary{skins,breakable,listings}
\newtcblisting[use counter=lstlisting]{pycode}[2][]{%
        enhanced,noparskip,breakable,colback=light-gray,colframe=DarkSlateGray,opacitybacktitle=.8,%
        fonttitle=\bfseries,before upper={\hspace*{-1em}\includegraphics[height=\baselineskip]{example-image-a}~#2},%
        title after break={\centering\footnotesize\itshape\strut\lstlistingname~\thelstlisting~--~continued},%
        listing only,listing options={xleftmargin=-1mm},after upper={\centering\strut\lstlistingname~\thelstlisting:~#2},
        frame hidden,arc=0pt,outer arc=0pt,boxrule=0pt,frame code={\draw[gray,line width=2mm]([xshift=-0.5pt]frame.north west) -- ([xshift=-0.5pt]frame.south west);},#1}

\newtcblisting[use counter=lstlisting]{mcode}[2][]{%
        enhanced,noparskip,breakable,colback=light-gray,colframe=DarkSlateGray,opacitybacktitle=.8,%
        fonttitle=\bfseries,before upper={\hspace*{-1em}\includegraphics[height=\baselineskip]{example-image-b}~#2},%
        title after break={\centering\footnotesize\itshape\strut\lstlistingname~\thelstlisting~--~continued},%
        listing only,listing options={xleftmargin=-1mm},after upper={\centering\strut\lstlistingname~\thelstlisting:~#2},
        frame hidden,arc=0pt,outer arc=0pt,boxrule=0pt,frame code={\draw[gray,line width=2mm] ([xshift=-0.5pt]frame.north west) -- ([xshift=-0.5pt]frame.south west);},#1}


\begin{document}

\begin{mcode}{Some Matlab Code}
V = diag([0.02, 0.5*pi/180].^2);
P0 = diag([0.005, 0.005, 0.001].^2);
W = diag([0.1, 1*pi/180].^2);
map = LandmarkMap(20);
veh = Bicycle('covar', V);
veh.add_driver( RandomPath(map.dim) );
\end{mcode}

\begin{pycode}{Some Python Code}
"""
===============

Many plot types can be combined in one figure to create
powerful and flexible representations of data.
"""

import matplotlib.pyplot as plt
import numpy as np

# np.random.seed(19680801)
# data = np.random.randn(2, 100)
#
# fig, axs = plt.subplots(2, 2, figsize=(5, 5))
# axs[0, 0].hist(data[0])
# axs[1, 0].scatter(data[0], data[1])
# axs[0, 1].plot(data[0], data[1])
# axs[1, 1].hist2d(data[0], data[1])

fig, ax = plt.subplots()
plt.plot(x, y, label='Loaded from file!')
plt.fill_between(x, y, color='#539ecd')
\end{pycode}


\end{document}
答案1
回答您的问题:
语法高亮由库/包
language=...的键和样式支持,例如、、和(用于行号)。将颜色命令传递给您的(或的键内) 中的这些样式,您将获得高亮。listingskeywordstylecommentstylestringstylenumberstyle\lstdefinestylelisting options\newtcblisting编辑评论:我不熟悉
Matlab-editor您使用的 matlab 语法样式。如果效果不佳,请尝试language=Matlabtcolorbox 包支持的主要参数。- 背景颜色由键控制
colback。如您所定义,它是light-gray。 - 标题可以通过 tcblisting 的键定义
title。对于自动编号,我手动为 Python 和 Matlab 创建计数器,并将use counter=<counter name>选项传递给\newtcblisting命令。
以下是仅包含核心命令的 MWE,用于解决上述问题:
\documentclass{article}

\usepackage{tcolorbox}
\tcbuselibrary{listings}

\lstdefinestyle{pycode}{
    keywordstyle=\color{blue},
    commentstyle=\color{green!50!black},
    numbers=left,
    numberstyle=\tiny,
    language=Python
}

\usepackage[numbered,framed]{matlab-prettifier}
\lstdefinestyle{mcode}{
    style={Matlab-editor}
}

\newcounter{pylst}
\newtcblisting[use counter=pylst]{pycode}[2][]{%
    colback=white,
    title={#2}, coltitle=black,
    detach title,
    after upper={\par\centering Python Code~\thetcbcounter:~\tcbtitle},
    listing only,
    listing options={style=pycode},
    #1
}

\newcounter{mlst}
\newtcblisting[use counter=mlst]{mcode}[2][]{%
    colback=white,
    title={#2}, coltitle=black,
    detach title,
    after upper={\par\centering Matlab Code~\thetcbcounter:~\tcbtitle},
    listing only,
    listing options={style=mcode},
    #1
}

\begin{document}

A python code environment:

\begin{pycode}{Py title}
import numpy as np  # Import
\end{pycode}

A Matlab example:
\begin{mcode}{Matlab title}
X = eye(4);
\end{mcode}

Another python example:
\begin{pycode}{Py title2}
s = "Helloworld"
\end{pycode}

\end{document}
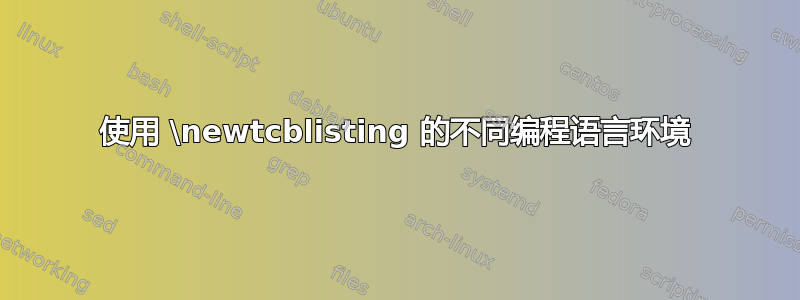
输出结果如下:
