

我该如何在 Latex 中绘制这样的东西?我真的不知道。非常感谢您的帮助!!

答案1
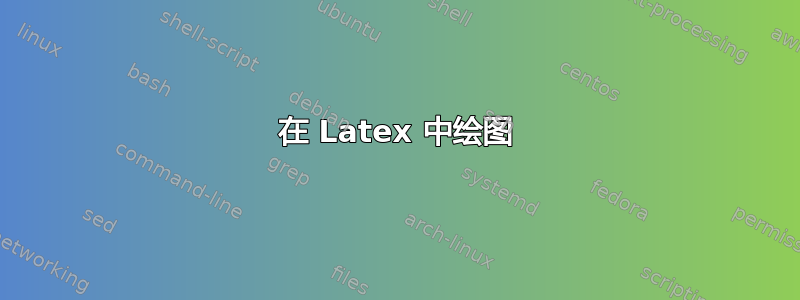
类似的情节已经有很多了,这里又有一个。
\documentclass[tikz,border=3mm]{standalone}
\begin{document}
\begin{tikzpicture}
 \draw[semithick,-latex] (0,-0.5) -- (0,4) node[below left]{$y$};
 \draw[semithick,-latex] (-0.5,0) -- (6,0) node[below left]{$t$};
 \draw[red,very thick] (2,1) to[out=40,in=180,looseness=1.6] (3.5,1)
  to[out=00,in=180] (4.2,1.2) node[above,black]{$y=\phi(t)$}
   to[out=00,in=190,looseness=1.7] (5.5,1);
 \draw[dashed] (2,0) node[below]{$t_0$} |- (0,1) node[left]{$y_0$}
    node[pos=0.5,circle,fill,inner sep=1.5pt](d){};
 \draw[thick] (d) + (220:1) -- ++ (40:2.5) coordinate[pos=0.85](p);
 \draw[latex-] (p) -- ++ (130:1) node[above] {$\mbox{slope}=y'(t_0)=y_1$};
\end{tikzpicture}
\end{document}
