

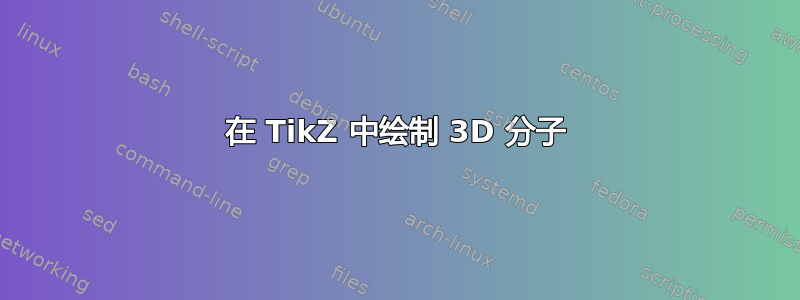
我正在尝试在 中制作一个甲烷分子tikz-3d。剩下的就是制作“化学上正确的”楔形和破折号。我尝试使用chemfig,但这只允许假装是 3D 的 2D 分子。然而它的楔形和破折号正是我想要的(蓝色分子)。
我想稍后使用这个图形,现在有了 3D 矢量等,所以使用chemfig不是一个选择。它必须是 3D 图形。我需要某种从任何角度看起来“三角形”的物体,所以我尝试制作圆锥体。我的尝试是
\documentclass[tikz]{standalone}
\usetikzlibrary{positioning}
\usepackage{tikz-3dplot,calc}
\usepackage{chemfig}

\begin{document}
\tdplotsetmaincoords{85}{90}% Determines point of view
\begin{tikzpicture}[tdplot_main_coords]

\def\c{1.5}

\coordinate (c01) at (0,0,0);
\coordinate (h01) at (\c,\c,\c);
\coordinate (h02) at (-\c,-\c,\c);
\coordinate (h03) at (\c,-\c,-\c);
\coordinate (h04) at (-\c,\c,-\c);
\coordinate (cor01) at (\c,-\c,\c);
\coordinate (cor02) at (-\c,\c,\c);
\coordinate (cor03) at (\c,\c,-\c);
\coordinate (cor04) at (-\c,-\c,-\c);

% Cube's edges
\begin{scope}[thick,line join = round]
\draw (h01) -- (cor01) -- (h02) -- (cor02) -- cycle;
\draw (h03) -- (cor04) -- (h04) -- (cor03) -- cycle;
\draw (h03) -- (cor01);
\draw (h02) -- (cor04);
\draw (h04) -- (cor02);
\draw (h01) -- (cor03);
\end{scope}

% Attempt to draw a wedge
\coordinate (h01up) at ($(h01)+(-0.2*\c,-0.2*\c,0)$);
\coordinate (h01do) at ($(h01)+(0,0,-0.2*\c)$);
\begin{scope}[very thick]
\draw (c01) -- (h01);
\fill[black] (c01) -- (h01) to [out=0,in=0] (h01do) to [out=180,in=180] (h01up) to [out=0,in=0] (h01do) -- (c01);
\draw[line width=0.25em,dash pattern={on 1pt off 1pt}] (c01) -- (h02);
\draw (c01) -- (h03);
\draw (c01) -- (h04);
\end{scope}

% Atoms
\colorlet{hyd}{white}
\colorlet{carb}{black!80}
\colorlet{atomshell}{black}

\filldraw[fill=carb,draw=atomshell,thick] (c01) circle [radius=10pt];
\filldraw[fill=hyd,draw=atomshell,thick] (h01) circle [radius=5pt];
\filldraw[fill=hyd,draw=atomshell,thick] (h02) circle [radius=5pt];
\filldraw[fill=hyd,draw=atomshell,thick] (h03) circle [radius=5pt];
\filldraw[fill=hyd,draw=atomshell,thick] (h04) circle [radius=5pt];

\node at (h01) [above] {$h_1$};
\node at (h02) [above] {$h_2$};

\begin{scope}[xshift = -7.5em, yshift = -6em]
\draw [->] (0,0,0) -- (0.75,0,0) node [below right=-0.2em and -0.2em] {$x$};
\draw [->] (0,0,0) -- (0,0.75,0) node [below left= -0.2em and -0.2em] {$y$};
\draw [->] (0,0,0) -- (0,0,0.6) node [below left] {$z$};
\end{scope}

\node at (0,3.5,0) {\color{blue}\chemfig{(-[:215]H)(-[:325]H)(<[:115]H)(<:[:65]H)}};
\end{tikzpicture}
\end{document}

答案1
欢迎!好问题。这是使用切线和剪辑的方法。
\documentclass[tikz]{standalone}
\usetikzlibrary{backgrounds,positioning}
\usepackage{tikz-3dplot}
\usepackage{chemfig}

\begin{document}
\tdplotsetmaincoords{85}{90}% Determines point of view
\begin{tikzpicture}[tdplot_main_coords,
H atom/.style={circle,fill=hyd,draw=atomshell,thick,inner sep=5pt},
C atom/.style={circle,fill=carb,draw=atomshell,thick,inner sep=10pt}]

\def\c{1.5}

\coordinate (c01) at (0,0,0);

% Cube's edges
\begin{scope}[thick,line join = round]
\draw (\c,\c,\c)  coordinate (h01)
    -- (\c,-\c,\c) coordinate (cor01)
    -- (-\c,-\c,\c) coordinate (h02) -- (-\c,\c,\c) coordinate (cor02)
    -- cycle;
\draw (\c,-\c,-\c) coordinate (h03) edge (cor01)
   -- (-\c,-\c,-\c) coordinate (cor04) edge (cor04)
    -- (-\c,\c,-\c) coordinate (h04) edge (cor02)
    -- (\c,\c,-\c) coordinate (cor03) edge  (h01) -- cycle;
\end{scope}

% Attempt to draw a wedge
\coordinate (h01up) at ($(h01)+(-0.2*\c,-0.2*\c,0)$);
\coordinate (h01do) at ($(h01)+(0,0,-0.2*\c)$);

% Atoms
\colorlet{hyd}{white}
\colorlet{carb}{black!80}
\colorlet{atomshell}{black}

\path (c01) node[C atom]{}
    foreach \X in {1,...,4}
    {\ifnum\X<3
    (h0\X) node[H atom,label=above:{$h_\X$}](H0\X){}
    \else
    (h0\X) node[H atom](H0\X){}
    \fi   } (h02) edge[thick] (cor01);

\begin{scope}[on background layer]
 \begin{scope}[very thick]
  \draw (c01) -- (H03);
  \draw (c01) -- (H04);
 \end{scope}
 \draw[fill] (tangent cs:node=H01, point={(c01)}, solution=1)
  -- (c01) --  (tangent cs:node=H01, point={(c01)}, solution=2);
 \clip (tangent cs:node=H02, point={(c01)}, solution=1)
  -- (c01) --  (tangent cs:node=H02, point={(c01)}, solution=2);
 \draw[line width=15pt,dash pattern={on 1pt off 1pt}] (c01) -- (h02);
\end{scope}
\begin{scope}[xshift = -7.5em, yshift = -6em]
\draw [->] (0,0,0) -- (0.75,0,0) node [below right=-0.2em and -0.2em] {$x$};
\draw [->] (0,0,0) -- (0,0.75,0) node [below left= -0.2em and -0.2em] {$y$};
\draw [->] (0,0,0) -- (0,0,0.6) node [below left] {$z$};
\end{scope}

\node at (0,3.5,0) {\color{blue}\chemfig{(-[:215]H)(-[:325]H)(<[:115]H)(<:[:65]H)}};
\end{tikzpicture}
\end{document}

如果不想剪辑,可以使用装饰expanding waves。
\documentclass[tikz]{standalone}
\usetikzlibrary{backgrounds,positioning,decorations.pathreplacing}
\usepackage{tikz-3dplot}
\usepackage{chemfig}

\begin{document}
\tdplotsetmaincoords{85}{90}% Determines point of view
\begin{tikzpicture}[tdplot_main_coords,
H atom/.style={circle,fill=hyd,draw=atomshell,thick,inner sep=5pt},
C atom/.style={circle,fill=carb,draw=atomshell,thick,inner sep=10pt}]

\def\c{1.5}

\coordinate (c01) at (0,0,0);

% Cube's edges
\begin{scope}[thick,line join = round]
\draw (\c,\c,\c)  coordinate (h01)
    -- (\c,-\c,\c) coordinate (cor01)
    -- (-\c,-\c,\c) coordinate (h02) -- (-\c,\c,\c) coordinate (cor02)
    -- cycle;
\draw (\c,-\c,-\c) coordinate (h03) edge (cor01)
   -- (-\c,-\c,-\c) coordinate (cor04) edge (cor04)
    -- (-\c,\c,-\c) coordinate (h04) edge (cor02)
    -- (\c,\c,-\c) coordinate (cor03) edge  (h01) -- cycle;
\end{scope}

% Attempt to draw a wedge
\coordinate (h01up) at ($(h01)+(-0.2*\c,-0.2*\c,0)$);
\coordinate (h01do) at ($(h01)+(0,0,-0.2*\c)$);

% Atoms
\colorlet{hyd}{white}
\colorlet{carb}{black!80}
\colorlet{atomshell}{black}

\path (c01) node[C atom]{}
    foreach \X in {1,...,4}
    {\ifnum\X<3
    (h0\X) node[H atom,label=above:{$h_\X$}](H0\X){}
    \else
    (h0\X) node[H atom](H0\X){}
    \fi   } (h02) edge[thick] (cor01);

\begin{scope}[on background layer]
 \begin{scope}[very thick]
  \draw (c01) -- (H03);
  \draw (c01) -- (H04);
 \end{scope}
 \draw[fill] (tangent cs:node=H01, point={(c01)}, solution=1)
  -- (c01) --  (tangent cs:node=H01, point={(c01)}, solution=2);
 \draw[decorate,decoration={expanding waves,angle=5,segment length=3pt},very thick]
 (c01) -- (h02);
\end{scope}
\begin{scope}[xshift = -7.5em, yshift = -6em]
\draw [->] (0,0,0) -- (0.75,0,0) node [below right=-0.2em and -0.2em] {$x$};
\draw [->] (0,0,0) -- (0,0.75,0) node [below left= -0.2em and -0.2em] {$y$};
\draw [->] (0,0,0) -- (0,0,0.6) node [below left] {$z$};
\end{scope}
\node at (0,3.5,0) {\color{blue}\chemfig{(-[:215]H)(-[:325]H)(<[:115]H)(<:[:65]H)}};
\end{tikzpicture}
\end{document}

附录:只是为了好玩。这需要3D 工具库。这以与约定无关的方式实现了 3d 排序。只要您有某种方法可以为您提供坐标的定向正交投影,该函数screendepth就会为您提供与虚拟屏幕的 3d 距离。距离观看者较近的坐标将具有较大的屏幕深度。实现正交投影的工具包括tikz-3dplot和perspective库,但它们的约定不同。此处的函数使用 Ti钾Z 坐标。具体来说,这也意味着我们可以仅从 Ti 完全重建旋转矩阵钾Z' 簿记变量,如\pgf@xx。以下动画展示了一种可能的应用。如果键指向较远的物体,则为虚线;如果原子较近,则为楔形;如果原子距离大致相等,则为粗线。我完全没有注意到立方体线。
\documentclass[tikz]{standalone}
\usetikzlibrary{backgrounds,positioning,decorations.pathreplacing,fpu,3dtools}
\usepackage{tikz-3dplot}
\usepackage{chemfig}
\makeatletter
\pgfmathdeclarefunction{screendepth}{1}{%
\begingroup%
\edef\mycoord{\RawCoord(#1)}%
\edef\screenvec{{(\the\pgf@yx)*(\the\pgf@zy)-(\the\pgf@yy)*(\the\pgf@zx)},%
{(\the\pgf@zx)*(\the\pgf@xy)-(\the\pgf@xx)*(\the\pgf@zy)},%
{(\the\pgf@xx)*(\the\pgf@yy)-(\the\pgf@yx)*(\the\pgf@xy)}}%
\pgfkeys{/pgf/fpu,/pgf/fpu/output format=fixed}%
\pgfmathparse{TD("(#1)o(\screenvec)")/1cm/1cm}%
\pgfmathsmuggle\pgfmathresult\endgroup%
}%

\makeatother
\newcommand\ConnectAtoms[3][]{%
\pgfmathsetmacro{\depthA}{screendepth("#2")}%
\pgfmathsetmacro{\depthB}{screendepth("#3")}%
\pgfmathtruncatemacro{\itest}{1+(abs(\depthA-\depthB)<0.1 ?0 : sign(\depthA-\depthB))}%
\ifcase\itest
\draw[decorate,decoration={expanding waves,angle=5,segment length=3pt},
 very thick,#1]
 (#2) -- (#3);
\or
\draw[very thick,#1]
 (#2) -- (#3);
\or
\path[fill,#1] (tangent cs:node=#3, point={(#2)}, solution=1)
  -- (#2) --  (tangent cs:node=#3, point={(#2)}, solution=2);
\fi
}


\begin{document}
\foreach \Angle in {5,15,...,355}
{\tdplotsetmaincoords{90+20*cos(\Angle)}{\Angle}% Determines point of view
\begin{tikzpicture}[tdplot_main_coords,
H atom/.style={circle,fill=hyd,draw=atomshell,thick,inner sep=5pt},
C atom/.style={circle,fill=carb,draw=atomshell,thick,inner sep=10pt}]
% Atoms
\colorlet{hyd}{white}
\colorlet{carb}{black!80}
\colorlet{atomshell}{black}
\path[tdplot_screen_coords,use as bounding box] (-3,-3) rectangle (3,3);
\def\c{1.5}

\path  (0,0,0) coordinate  (c01) node[C atom]{};

% Cube's edges
\begin{scope}[thick,line join = round]
\draw (\c,\c,\c)  coordinate (h01) node[H atom,label=above:{$h_1$}](H01){}
    -- (\c,-\c,\c) coordinate (cor01)
    -- (-\c,-\c,\c) coordinate (h02) node[H atom,label=above:{$h_2$}](H02){}
    -- (-\c,\c,\c) coordinate (cor02)
    -- cycle;
\draw (\c,-\c,-\c) coordinate (h03) node[H atom](H03){}
   -- (-\c,-\c,-\c) coordinate (cor04) edge (H02)
    -- (-\c,\c,-\c) coordinate (h04) node[H atom](H04){}
    -- (\c,\c,-\c) coordinate (cor03) edge  (H01) -- cycle
    (cor01) edge (H03)
    (cor02) edge (H04);
\end{scope}


\path (h02) edge[thick] (cor01)
    (h04) edge[thick] (cor03);
\pgfmathsetmacro{\depthA}{screendepth("c01")}%
\pgfmathsetmacro{\depthB}{screendepth("h03")}%
\begin{scope}[on background layer]
 \foreach \X in {1,2,3,4}
 {\ConnectAtoms{c01}{H0\X}}
\end{scope}
\end{tikzpicture}}
\end{document}
