

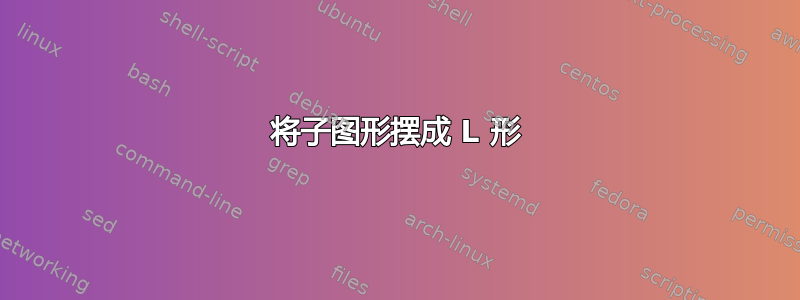
我正在尝试放置 3 个数字和一些文字;如下所示:

但到目前为止我只得到这个:

我的代码是:
\documentclass[t]{beamer}

\usepackage{subcaption}
\usepackage{pgfplots}

\begin{document}
\begin{frame}
    ~\\[1cm]
    \begin{figure}
        \begin{subfigure}{0.49\linewidth}
            {\scriptsize $t=0$~s}.


            {\scriptsize $r=0$~m}.


            {\scriptsize $585$ macro-particles}.


            {\scriptsize $\overline{T} = 152.4$~K}.
        \end{subfigure}\hfill
        \begin{subfigure}{0.49\linewidth}
            \begin{tikzpicture}
            \begin{axis}[
            width = \linewidth,
            ylabel near ticks,
            yticklabel pos=right,
            ylabel = {\tiny Particle Density~[m$^{-3}$]},
            xtick=\empty,
            ymin = 0,
            ymax = 77162484572430.92,
            xmin = 0.03157490368073539,
            xmax = 0.03653007600471181,
            ticklabel style = {font=\tiny},
            ]
            \end{axis}
            \end{tikzpicture}
        \end{subfigure}
        \begin{subfigure}{0.49\linewidth}
            \begin{tikzpicture}
            \begin{axis}[
            width = \linewidth,
            ytick=\empty,
            xlabel = {\tiny Probability Density},
            ymin = -217828.00503348646,
            ymax = 213540.67299828946,
            xmax = 1.1333435035653558e-05,
            xmin = 0,
            x dir = reverse,
            ticklabel style = {font=\tiny},
            ]
            \end{axis}
            \end{tikzpicture}
        \end{subfigure}
        \begin{subfigure}{0.49\linewidth}
            \begin{tikzpicture}
            \begin{axis}[
            width = \linewidth,
            ylabel near ticks,
            yticklabel pos=right,
            ylabel = {\tiny Speed~[m/s]},
            xlabel = {\tiny $z$~[m]},
            xmin = 0.03157490368073539,
            xmax = 0.03653007600471181,
            ymin = -217828.00503348646,
            ymax = 213540.67299828946,
            ticklabel style = {font=\tiny},
            ]
            \end{axis}
            \end{tikzpicture}
        \end{subfigure}
    \end{figure}
\end{frame}

\end{document}
因此,我得到的和我想要的之间的区别是:三个图应该形成一个 L 形,并且彼此靠得更近。文本应该像第四个数字,并且文本居中。我尝试更改可选位置 [b、t、c],但我无法得到我想要的东西。
答案1
您可以在此处使用s。然后,您可以通过设置和grouplot来精确固定图的水平和垂直距离。horizontal sepvertical sep
\documentclass[t]{beamer}
\usepackage{siunitx}
\usepackage{pgfplots}
\pgfplotsset{compat=1.17}
\usepgfplotslibrary{groupplots}
\begin{document}
\begin{frame}
\frametitle{A group plot}
\centering
\begin{tikzpicture}
\begin{groupplot}[group style={group size=2 by 2,
     horizontal sep=1.2em,vertical sep=1.5em},
    xmin=0,height=4cm,width=5cm,no markers,
     ticklabel style = {font=\tiny},
     yticklabel pos=right,
     xlabel style= {font=\tiny},
     ylabel near ticks,
     ylabel style= {font=\tiny},
    ]
    \nextgroupplot[group/empty plot,alias=TL]
    \nextgroupplot[ylabel = {Particle Density~[m$^{-3}$]},
            xtick=\empty,
            ymin = 0,
            ymax = 77162484572430.92,
            xmin = 0.03157490368073539,
            xmax = 0.03653007600471181]
%
    \nextgroupplot[
            ytick=\empty,
            xlabel = {Probability Density},
            ymin = -217828.00503348646,
            ymax = 213540.67299828946,
            xmax = 1.1333435035653558e-05,
            xmin = 0,
            x dir = reverse,
            ]
%
    \nextgroupplot[
            ylabel = {Speed~[m/s]},
            xlabel = {$z$~[m]},
            xmin = 0.03157490368073539,
            xmax = 0.03653007600471181,
            ymin = -217828.00503348646,
            ymax = 213540.67299828946,
        ]
\end{groupplot}
\path (TL) node[align=left,font=\scriptsize]{$t=\SI{0}{\second}$\\[0.6em]
    $r=\SI{0}{\meter}$\\[0.6em]
    $585$ macro-particles\\[0.6em]
    $\overline{T} = \SI{152.4}{\kelvin}$};

\end{tikzpicture}
\end{frame}

\end{document}

答案2
使用表格可以实现与组图相同的效果。请注意,我在第一行中垂直对齐中心,在第二行中垂直对齐轴的底部。
该[trim axis left]选项将在行之间对齐轴的左侧,但可能需要额外的间距以防止重叠。 [trim axis right]允许图表靠得更近。无论是否使用,Pgfplots 都会保留注释空间。请参阅 [scale only axis] 键。
\documentclass[t]{beamer}
\usepackage{pgfplots}

\begin{document}
\begin{frame}\null\vfil
    \begin{figure}
      \begin{tabular}{ll}
        \hspace{1em}\parbox[c][2cm][s]{3cm}{\scriptsize
            $t=0$~s.
            \par\vfill
            $r=0$~m.
            \par\vfill
            $585$ macro-particles.
            \par\vfill
            $\overline{T} = 152.4$~K.} &
        \begin{tikzpicture}[baseline=(current bounding box.center)]
            \begin{axis}[trim axis left, trim axis right,
            width = 5cm,
            ylabel near ticks,
            yticklabel pos=right,
            ylabel = {\tiny Particle Density~[m$^{-3}$]},
            xtick=\empty,
            ymin = 0,
            ymax = 77162484572430.92,
            xmin = 0.03157490368073539,
            xmax = 0.03653007600471181,
            ticklabel style = {font=\tiny},
            ]
            \end{axis}
        \end{tikzpicture} \\
        \begin{tikzpicture}[baseline=(current axis.south)]
            \begin{axis}[trim axis left, trim axis right,
            width = 5cm,
            ytick=\empty,
            xlabel = {\tiny Probability Density},
            ymin = -217828.00503348646,
            ymax = 213540.67299828946,
            xmax = 1.1333435035653558e-05,
            xmin = 0,
            x dir = reverse,
            ticklabel style = {font=\tiny},
            ]
            \end{axis}
        \end{tikzpicture} &
        \begin{tikzpicture}[baseline=(current axis.south)]
            \begin{axis}[trim axis left, trim axis right,
            width = 5cm,
            ylabel near ticks,
            yticklabel pos=right,
            ylabel = {\tiny Speed~[m/s]},
            xlabel = {\tiny $z$~[m]},
            xmin = 0.03157490368073539,
            xmax = 0.03653007600471181,
            ymin = -217828.00503348646,
            ymax = 213540.67299828946,
            ticklabel style = {font=\tiny},
            ]
            \end{axis}
        \end{tikzpicture}
      \end{tabular}
    \end{figure}
\end{frame}

\end{document}
