

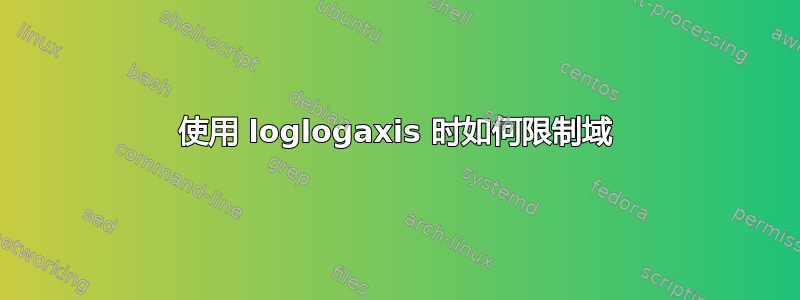
在这篇文章中,我看到可以使用来限制域\addplot[restrict x to domain=30:39]。但是,我在绘图时应该使用什么选项loglogaxis?MWE 如下...
\documentclass[border=5pt]{standalone}
\usepackage{pgfplots}

\begin{filecontents}{data.dat}
I, R, Fit
1.0, 3.13349212543455E-06, 1.17489755493953E-06
1.3, 3.22981374274449E-06, 1.33967668742594E-06
1.6, 3.55766505982124E-06, 1.52756605823807E-06
2.0, 3.27922898482482E-06, 1.74180687339162E-06
2.5, 3.27175430119927E-06, 1.98609491735737E-06
3.2, 3.50285954188249E-06, 2.26464430759306E-06
4.0, 3.48970219626136E-06, 2.5822601906346E-06
5.0, 3.35499887808043E-06, 2.94442163379876E-06
6.3, 3.92917194127669E-06, 3.35737614242955E-06
7.9, 4.85046864220778E-06, 3.82824743316823E-06
10.0, 4.45827700241831E-06, 4.36515832240166E-06
12.6, 4.96889158797292E-06, 4.97737084978937E-06
15.8, 5.46225224863929E-06, 5.67544605408547E-06
20.0, 6.30582603087795E-06, 6.47142615748584E-06
25.1, 7.16694441082286E-06, 7.37904230129102E-06
31.6, 8.32124478734666E-06, 8.41395141645196E-06
39.8, 1.04389981057236E-05, 9.59400631515934E-06
50.1, 1.11450691079548E-05, 1.09395636627209E-05
63.1, 1.26111928511412E-05, 1.24738351424294E-05
79.4, 1.4623846093962E-05, 1.42232878712282E-05
100.0, 1.70781417276372E-05, 1.62181009735893E-05
\end{filecontents}

\begin{document}

\begin{tikzpicture}
\begin{loglogaxis}[%
    width = 0.45\textwidth,
    height = 0.4\textwidth,
    grid = both,
    ymin = 0.0000001,
    ymax = 0.0001,
    scaled ticks = false,
    tick label style={/pgf/number format/fixed},
    xlabel = $I$ (mW),
    ylabel = $\Delta T/T$ (modulus),
    ticklabel style = {font=\footnotesize},
    legend style = {font=\tiny},
    legend cell align={left},
    legend pos = south east,
    ]

\addplot[color=black, only marks]
    table[col sep=comma,x=I,y=R]{data.dat}
    ;
    \addlegendentry{Measured}

\addplot[color=black, mark=none, ultra thick]
    table[col sep=comma,x=I,y=Fit]{data.dat}
    ;
    \addlegendentry{$\frac{\Delta T}{T} = 10^{-5.9} I^{0.57}$}

\addplot[color=red, mark=none, ultra thick, restrict x to domain=10:100]
    table[col sep=comma,x=I,y=Fit]{data.dat}
    ;
    \addlegendentry{Where is it?}

\end{loglogaxis}
\end{tikzpicture}


\end{document}