

这是我第一次使用 TikZ 并绘制了如下独立图表:
\documentclass[border=2pt]{standalone}

% math packages
\usepackage{amsmath}
\usepackage{amssymb}
\usepackage{bm}

% tikz
\usepackage{tikz}
\usetikzlibrary{%
    positioning,
    shadows,
    arrows,
    arrows.meta,
    fit,
    intersections,
    calc
}

% eigene styles definieren
\tikzset{%
    block/.style = {draw, thick, rectangle, drop shadow, fill = white},
    sum/.style = {draw, thick, circle, drop shadow, inner sep = .8mm, fill=white},
    point/.style = {coordinate}
}

\begin{document}

    \begin{tikzpicture}[auto, >=Triangle]

    \draw
    node [block,minimum height=8em] (sys) {Klärschlammverbrennungsanalge};

    \draw[->] (sys.10)--node[]{$T_B(t)$}(5,0.5);
    \draw[->] (sys.-10)--node[]{$C_{O_2}(t)$}(5,-0.5);
    \draw[->] (-5,0.5)--node[]{$\dot{m}_P(t)$}(-2.65,0.5);
    \draw[->] (-5,-0.5)--node[]{$\dot{m}_L(t)$}(-2.65,-0.5);


    \end{tikzpicture}

\end{document}
我想将 TikZ 包含到我的主程序中.tex,但节点周围的边框没有被绘制。只有箭头和文本显示正确。有什么线索可以解释为什么会发生这种情况吗?
这是我将其包含进去的方式:
\documentclass{article}
\usepackage[utf8]{inputenc}

\usepackage{tikz}
\usepackage{standalone}

\begin{document}
\begin{figure}
    \centering
    \includestandalone[width=\textwidth]{BasicSystem}
    \caption{Caption}
    \label{fig:my_label}
\end{figure}


\end{document}
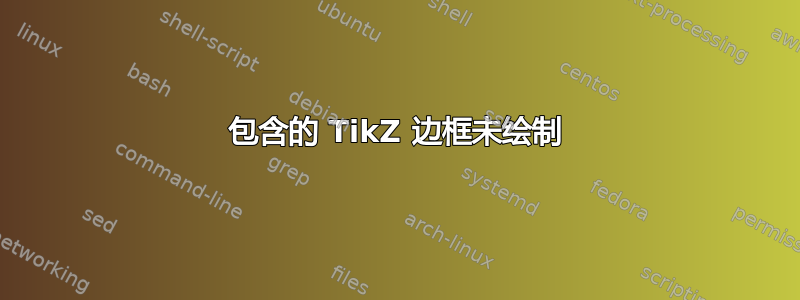
编辑:这是它单独时的样子以及包含时的样子


答案1
简而言之:
改成。\usepackage{standalone}\usepackage[subpreambles]{standalone}
更详细的解释:
来自`独立,第 6.2 节,
默认情况下,此
standalone软件包在加载时会删除所有子文件前导码(“子前导码”)。但是,如果使用选项加载此软件包subpreambles,则所有子前导码都会存储...
更改\usepackage{standalone}为,然后使用加载库和定义选项\usepackage[subpreambles]{standalone}的子文件的前导码,并绘制节点周围的框架/边框。tikztikz(sys)
关于使箭头tikzpicture更加一致
(基于评论作者:@TorbjørnT)
目标是使四支箭的长度相等(2厘米),水平方向平齐,并且两支箭的高度相等。
\documentclass[border=2pt]{standalone}

% math packages
\usepackage{amsmath}
\usepackage{amssymb}
\usepackage{bm}

% tikz
\usepackage{tikz}
\usetikzlibrary{%
    positioning,
    shadows,
    arrows,
    arrows.meta,
    fit,
    intersections,
    calc
}

% eigene styles definieren
\tikzset{%
    block/.style = {draw, thick, rectangle, drop shadow, fill = white},
    sum/.style = {draw, thick, circle, drop shadow, inner sep = .8mm, fill=white},
    point/.style = {coordinate}
}

\begin{document}

    \begin{tikzpicture}[auto, >=Triangle]

    \node[block,minimum height=8em] (sys) {Klärschlammverbrennungsanalge};

    \draw[->] (sys.10)   -- node        {$T_B(t)$}       +(2, 0);
    \draw[->] (sys.-10)  -- node        {$C_{O_2}(t)$}   +(2, 0);
    \draw[<-] (sys.170)  -- node[above] {$\dot{m}_P(t)$} +(-2, 0);
    \draw[<-] (sys.-170) -- node[above] {$\dot{m}_L(t)$} +(-2, 0);

    \end{tikzpicture}

\end{document}
