

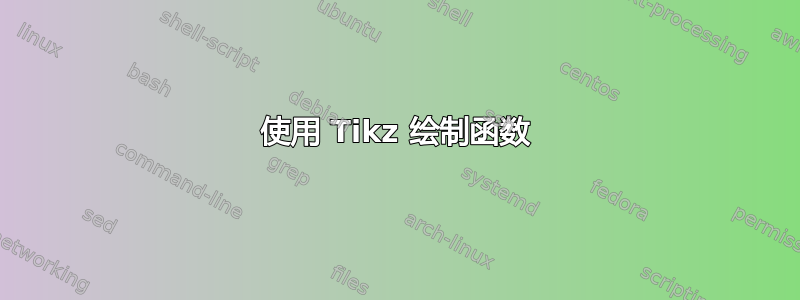
我想知道如何使用 tikz 绘制如下图所示的曲线。


答案1
node[pos=<fraction]{<stuff>}在 pgfplots 中,您只需在命令后添加即可在路径的某个部分添加节点\addplot。
\documentclass[tikz,border=3mm]{standalone}
\usepackage{pgfplots}
\pgfplotsset{compat=1.17}
\begin{document}
\begin{tikzpicture}
 \begin{axis}[hide axis,
    width=12cm,
    axis background/.style={path picture={
    \def\pbb{path picture bounding box}
    \fill[green!70!black] (\pbb.south west) -| (\pbb.east) -- cycle;
    \path (\pbb.east) -- (\pbb.north east) coordinate[pos=0.5] (aux);
    \fill[orange] (\pbb.south west) -- (\pbb.east) -- (aux) -- cycle;
    \fill[red] (\pbb.south west) -- (aux) -- (\pbb.north east) -| cycle;
    }},
    every axis plot/.append style={no marks,smooth,thick},
    xmin=0,xmax=100,ymin=0,ymax=100,domain=0:100]
  \addplot[white] {1} node[pos=0.99,above left]{$\mathsf{O}(1)$};
  \addplot[white] {1+5*ln(1+x)/ln(10)} node[pos=0.99,above  left]{$\mathsf{O}(\log N)$};
  \addplot[white] {1+0.6*x} node[pos=0.99,above left]{$\mathsf{O}(N)$};
  \addplot[white] {1+0.3*x*(1+ln(1+x)/ln(10))} node[pos=0.99,above  left]{$\mathsf{O}(N\,\log(N))$};
  \addplot[white,domain=0:50] {1+x*x/25} node[pos=0.97,below right]{$\mathsf{O}(N^2)$};
  \addplot[white,domain=0:17.63] {1+pow(2,x)/2048} node[pos=0.97,below  right]{$\mathsf{O}(2^N)$};
  \addplot[white,samples at={1,2,...,6}] {1+x!*100/6!} node[pos=0.97,below  right]{$\mathsf{O}(N!)$};
 \end{axis}
\end{tikzpicture}
\end{document}
